I need some help with this homework! r' CENGAGE I MINDTAP Homework (Ch 08) First, use the tan quadrilateral (dash symbols) to shade the area
I need some help with this homework!
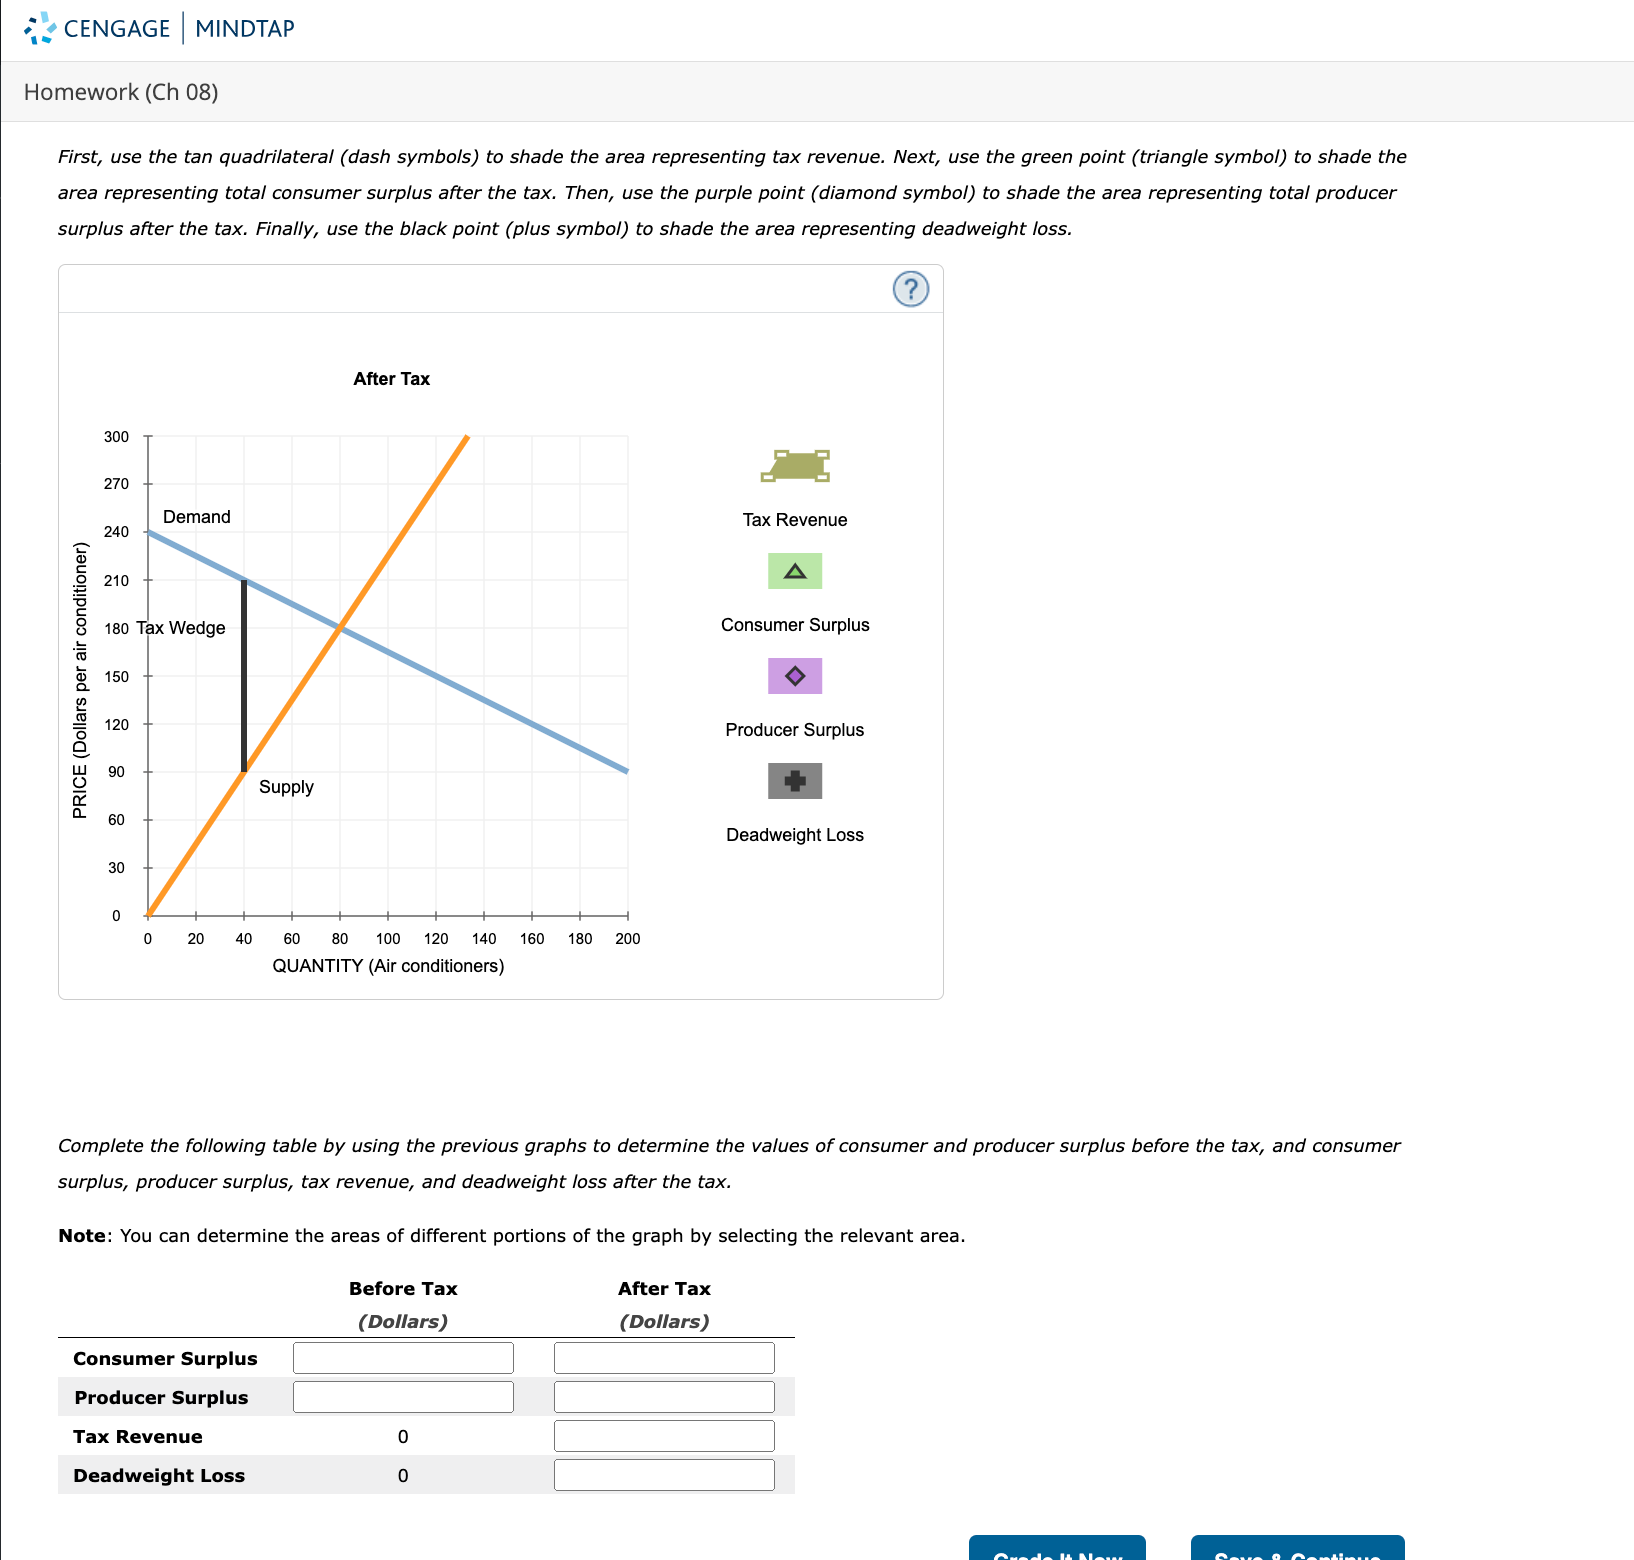
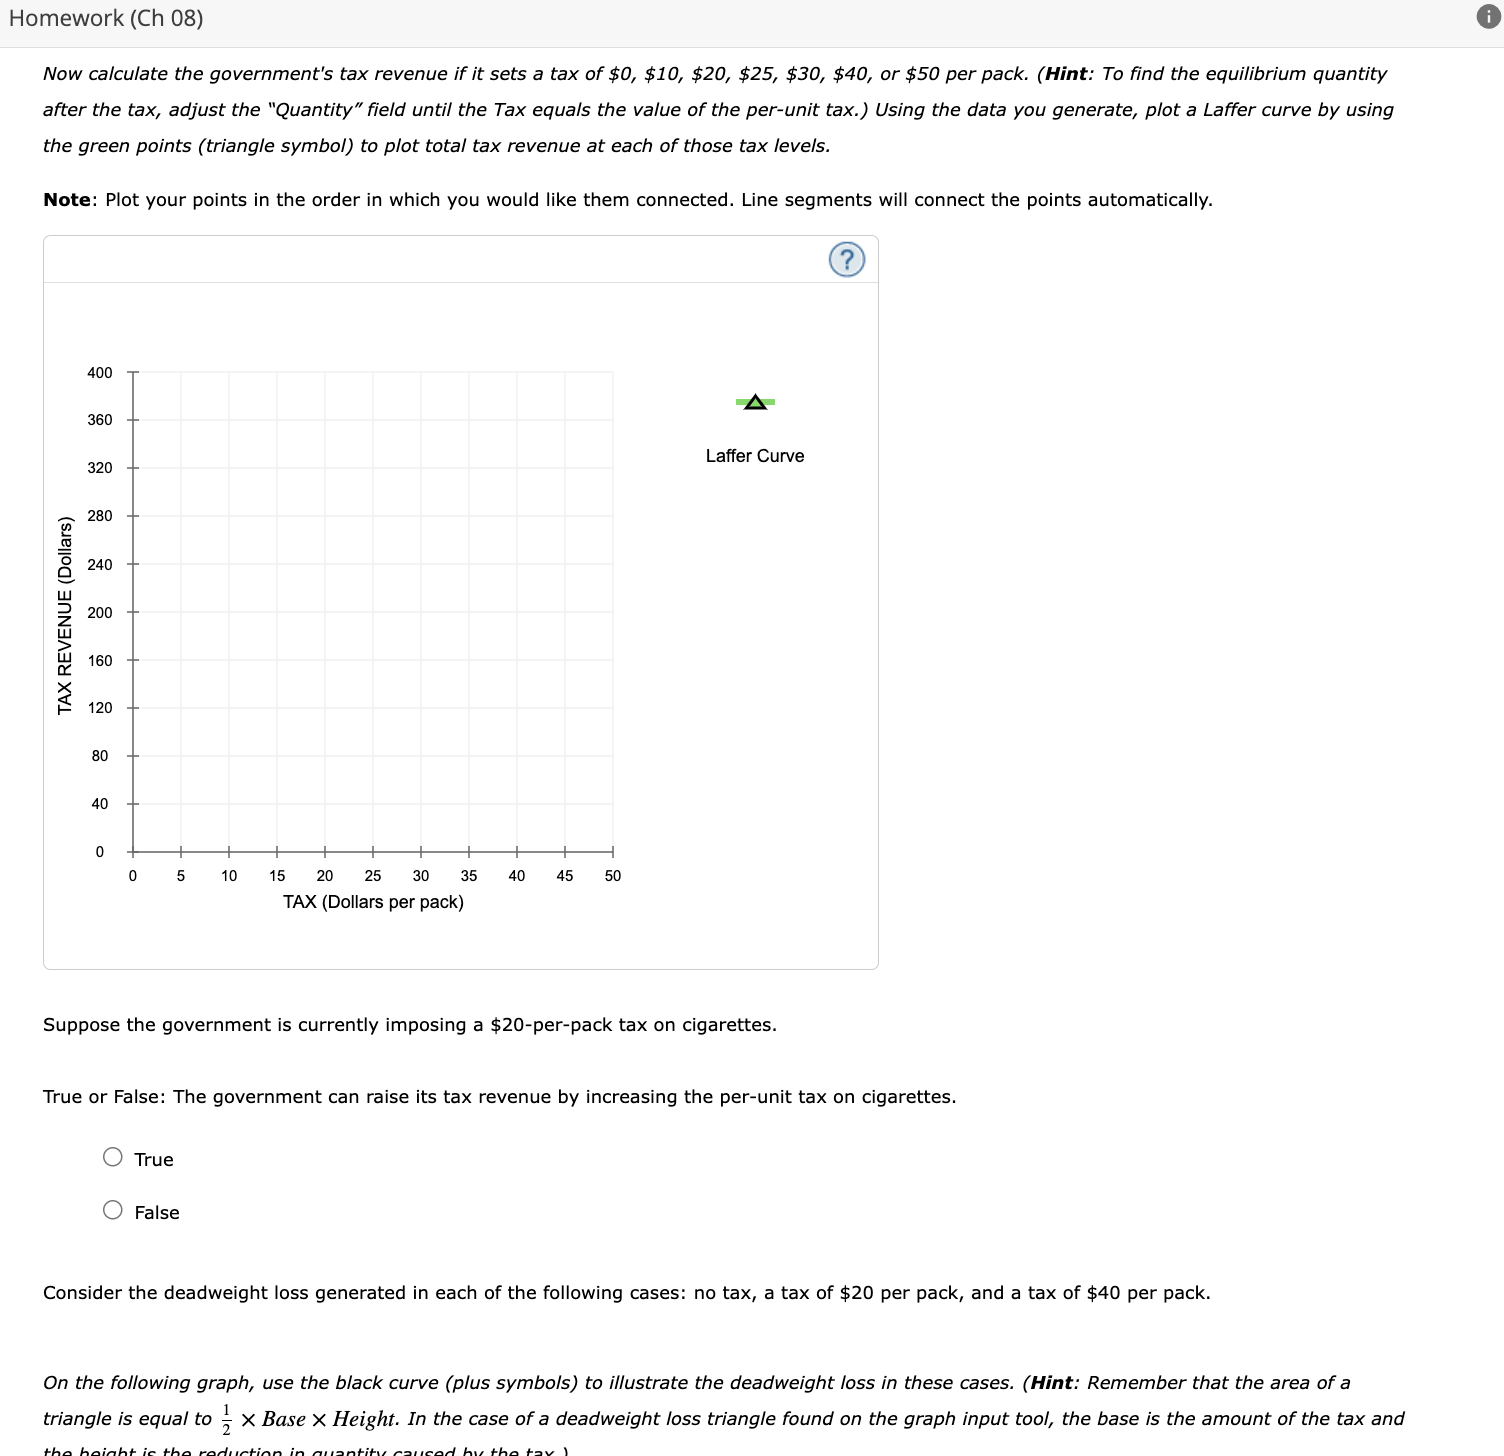
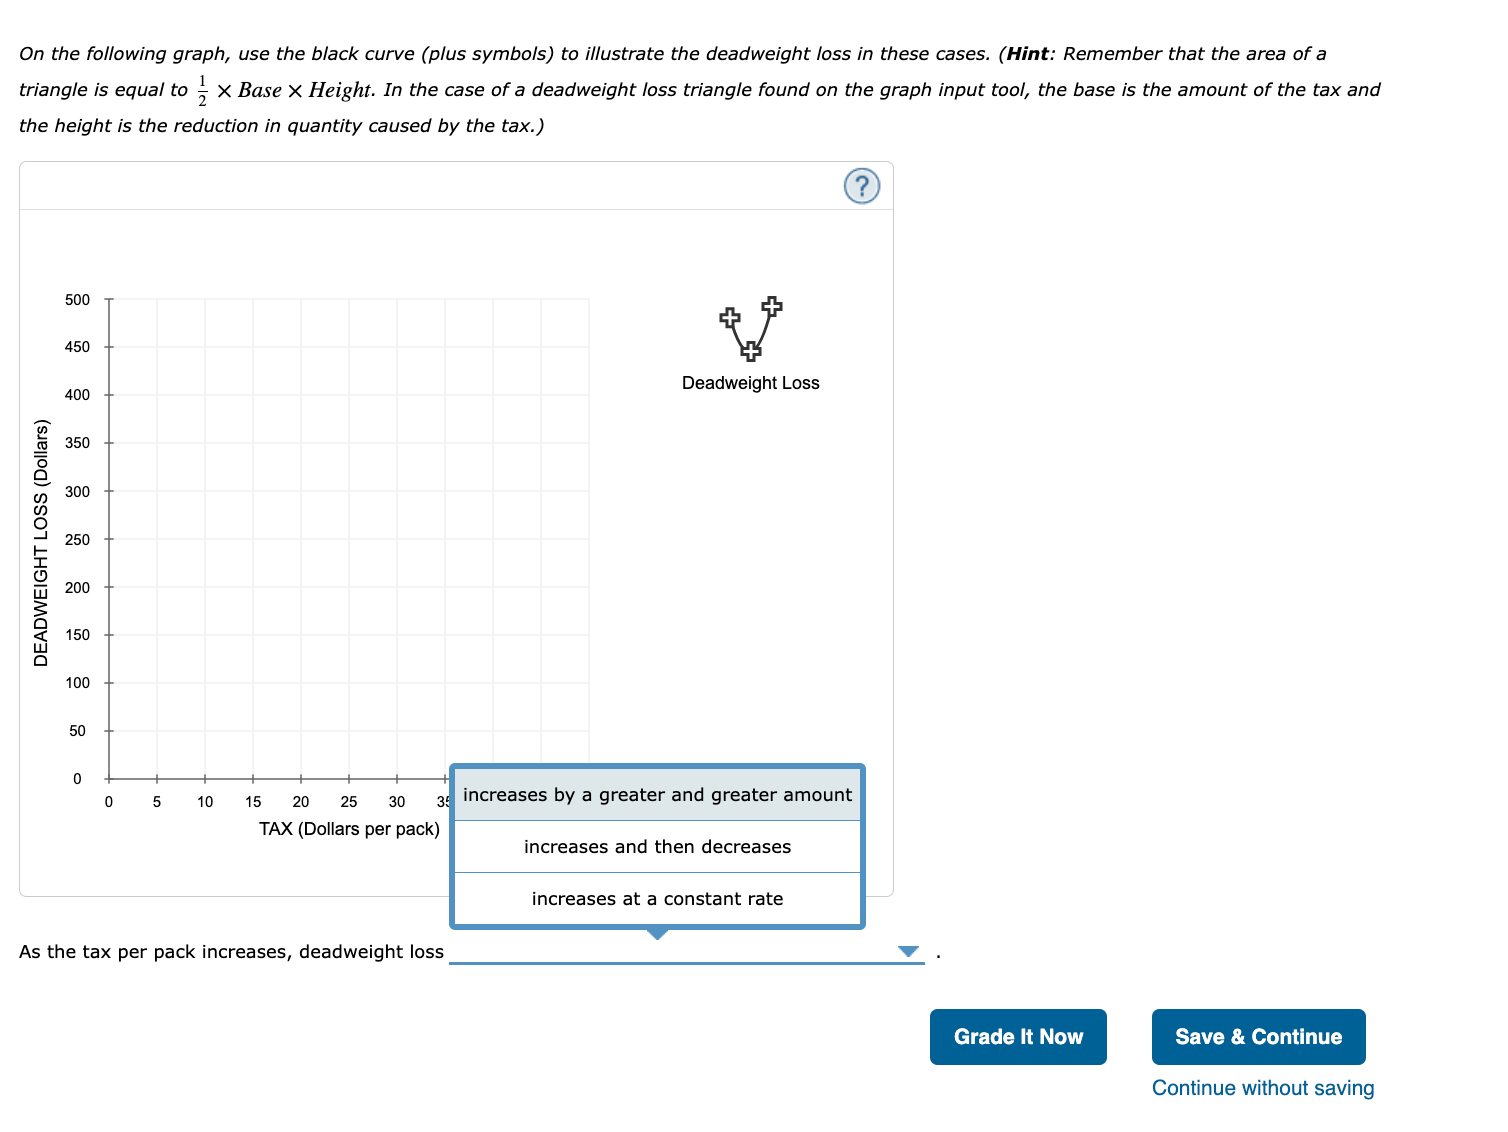
r'" CENGAGE I MINDTAP Homework (Ch 08) First, use the tan quadrilateral (dash symbols) to shade the area representing tax revenue. Next, use the green point (triangle symbol) to shade the area representing total consumer surplus after the tax. Then, use the purple point (diamond symbol) to shade the area representing total producer surplus after the tax. Finally, use the black point (plus symbol) to shade the area representing deadweight loss. @ Afler Tax 300 2770 Demand 240 Tax Revenue a E .g 210 A E 8 130 Tax Wedge Consumer Surplus '6 3 150 Q E (E E 120 Producer Surplus 9 NJ 90 2 Sn I I 1 PP Y n. :n o Deadweighf Loss u o n 10000000001 0 20 4O 60 80 100 120 140 160 180 200 QUANTITY (Air conditioners) Complete the foiiowing table by using the previous graphs to determine the values of consumer and producer surplus before the tax, and consumer surplus, producer surplus, tax revenue, and deadweight loss after the tax. Note: You can determine the areas of different portions of the graph by selecting the relevant area. Before Tax After Tax (Dollars) (Dollars) Consumer Surplus I I I I Producer Surplus I I I I Homework (Ch 08) Now calculate the government's tax revenue if it sets a tax of $0, $10, $20, $25, $30, $40, or $50 per pack. (Hint: To find the equilibrium quantity after the tax, adjust the "Quantity" field until the Tax equals the value of the per-unit tax. ) Using the data you generate, plot a Laffer curve by using the green points (triangle symbol) to plot total tax revenue at each of those tax levels. Note: Plot your points in the order in which you would like them connected. Line segments will connect the points automatically. 400 360 Laffer Curve 320 280 240 TAX REVENUE (Dollars) 200 160 120 80 40 0 5 10 15 20 25 30 35 40 45 50 TAX (Dollars per pack) Suppose the government is currently imposing a $20-per-pack tax on cigarettes. True or False: The government can raise its tax revenue by increasing the per-unit tax on cigarettes. O True O False Consider the deadweight loss generated in each of the following cases: no tax, a tax of $20 per pack, and a tax of $40 per pack. On the following graph, use the black curve (plus symbols) to illustrate the deadweight loss in these cases. (Hint: Remember that the area of a triangle is equal to - X Base X Height. In the case of a deadweight loss triangle found on the graph input tool, the base is the amount of the tax andOn the following graph, use the black curve (plus symbols) to illustrate the deadweight loss in these cases. (Hint: Remember that the area of a triangle is equal to - X Base X Height. In the case of a deadweight loss triangle found on the graph input tool, the base is the amount of the tax and the height is the reduction in quantity caused by the tax.) 500 450 Deadweight Loss 400 350 300 DEADWEIGHT LOSS (Dollars) 250 200 150 100 50 0 5 10 15 20 25 30 increases by a greater and greater amount TAX (Dollars per pack) increases and then decreases increases at a constant rate As the tax per pack increases, deadweight loss Grade It Now Save & Continue Continue without saving
Step by Step Solution
There are 3 Steps involved in it
Step: 1
Get Instant Access to Expert-Tailored Solutions
See step-by-step solutions with expert insights and AI powered tools for academic success
Step: 2
Step: 3
Ace Your Homework with AI
Get the answers you need in no time with our AI-driven, step-by-step assistance