

Answered step by step
Verified Expert Solution
Question
1 Approved Answer
I need the answer asap! thank you... Analysis and Interpretation of Profitability Balance sheets and income statements for 3M Company follow. Consolidated Statements of Income
I need the answer asap! thank you...
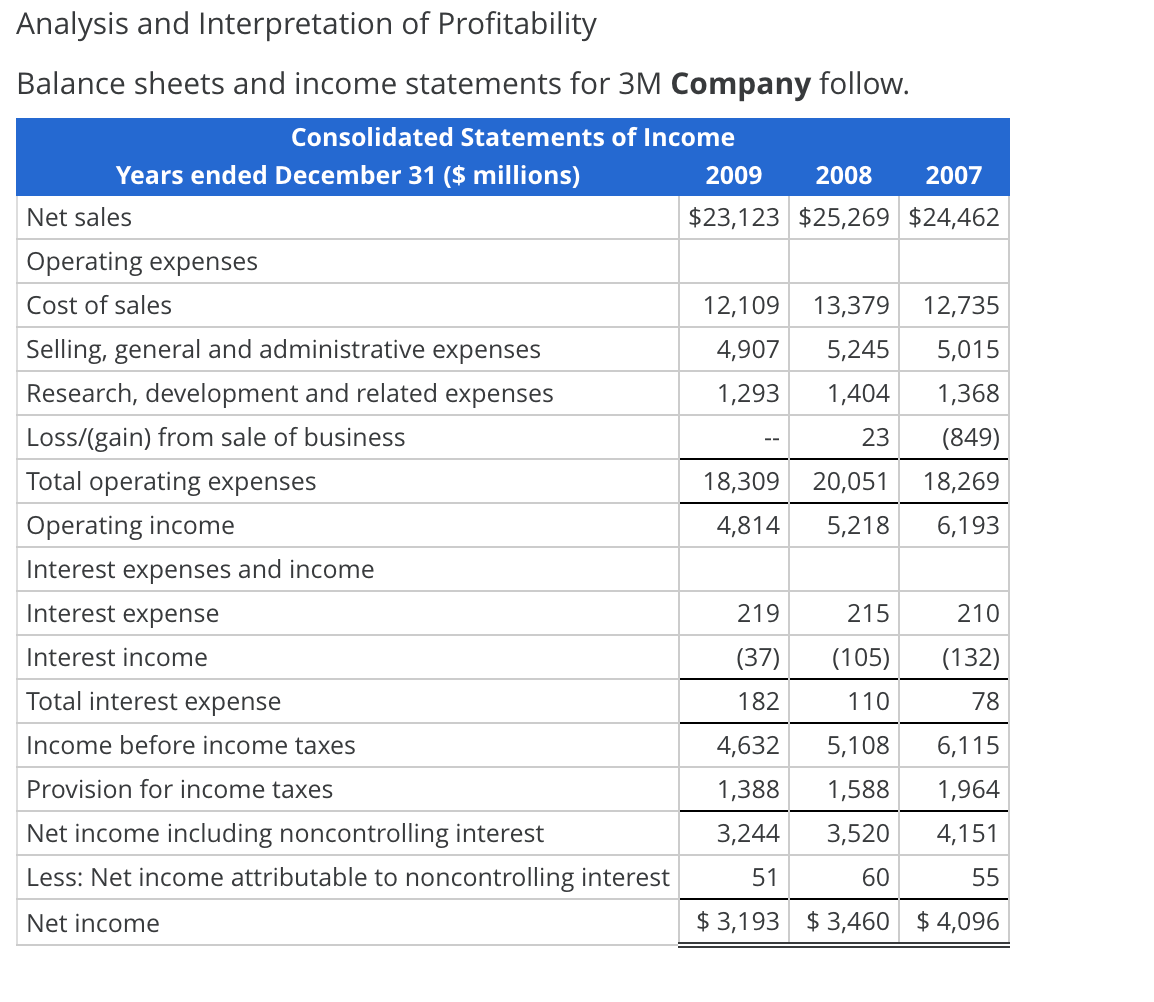
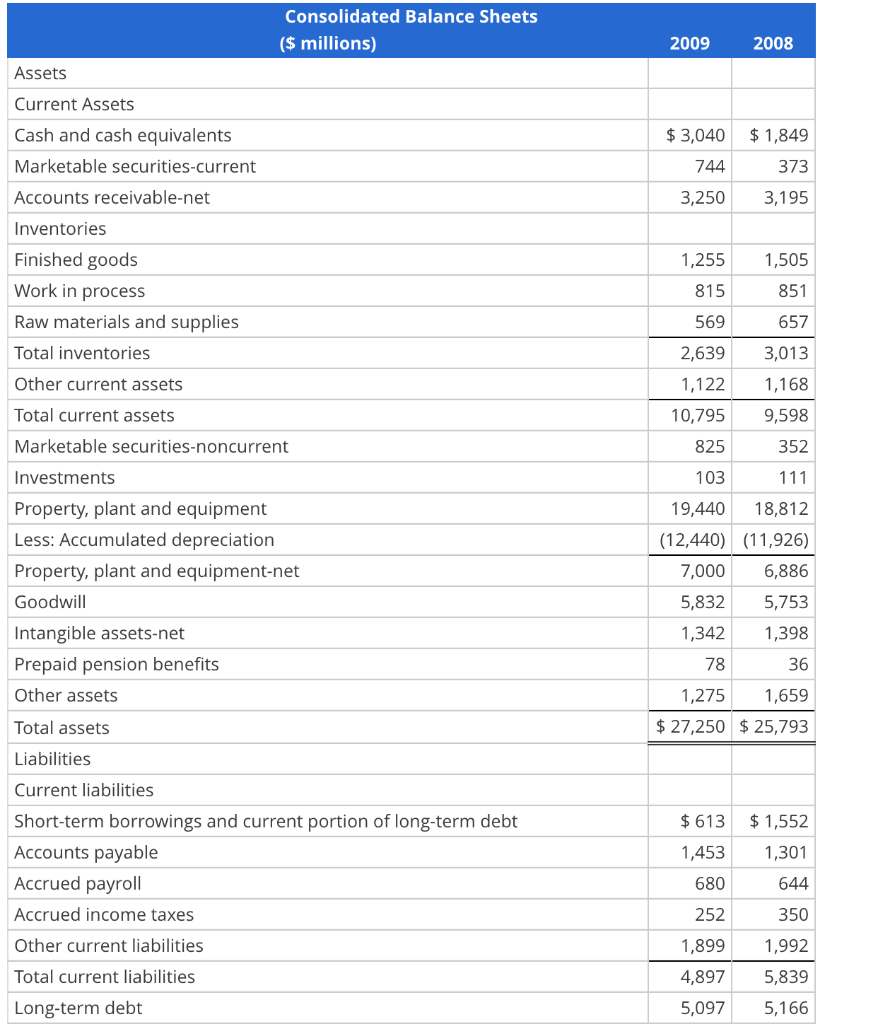
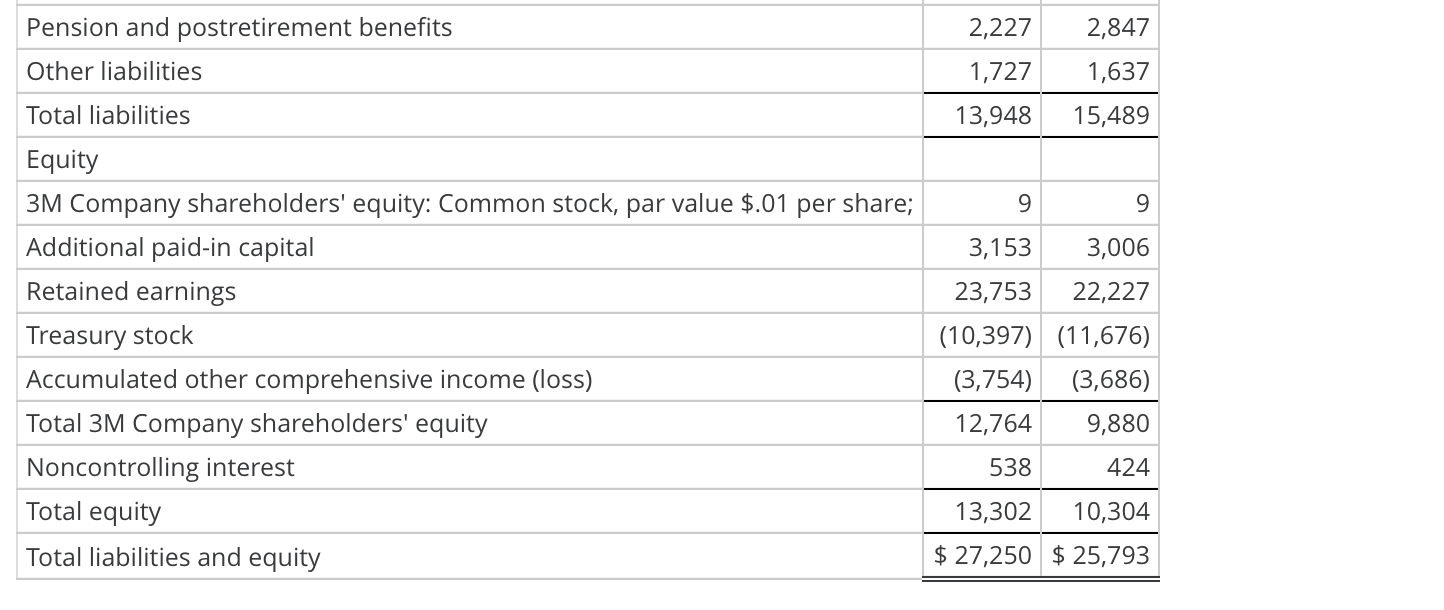
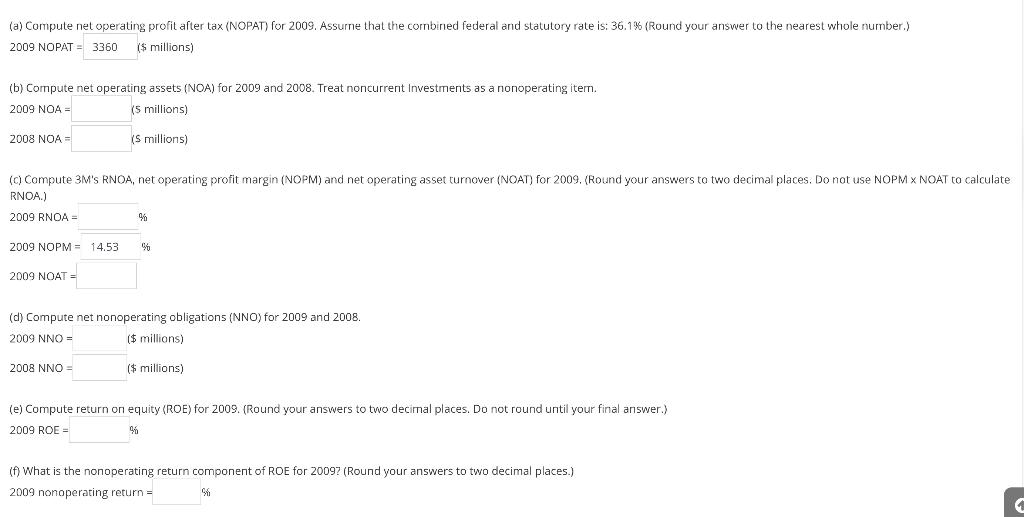
Analysis and Interpretation of Profitability Balance sheets and income statements for 3M Company follow. Consolidated Statements of Income Years ended December 31 ($ millions) 2009 2008 2007 Net sales $23,123 $25,269 $24,462 Operating expenses Cost of sales 12,109 13,379 12,735 Selling, general and administrative expenses 4,907 5,245 5,015 Research, development and related expenses 1,293 1,404 1,368 Loss/(gain) from sale of business 23 (849) Total operating expenses 18,309 20,051 18,269 Operating income 4,814 5,218 6,193 Interest expenses and income Interest expense 219 215 210 Interest income (37) (105) (132) Total interest expense 182 78 Income before income taxes 4,632 5,108 6,115 Provision for income taxes 1,388 1,588 1,964 Net income including noncontrolling interest 3,244 3,520 4,151 Less: Net income attributable to noncontrolling interest 51 60 55 Net income $ 3,193 $3,460 $ 4,096 110 2009 2008 $ 1,849 $ 3,040 744 373 3,250 3,195 1,255 1,505 815 851 569 657 Consolidated Balance Sheets ($ millions) Assets Current Assets Cash and cash equivalents Marketable securities-current Accounts receivable-net Inventories Finished goods Work in process Raw materials and supplies Total inventories Other current assets Total current assets Marketable securities-noncurrent Investments Property, plant and equipment Less: Accumulated depreciation Property, plant and equipment-net Goodwill Intangible assets-net Prepaid pension benefits Other assets 2,639 1,122 10,795 825 3,013 1,168 9,598 352 103 111 19,440 18,812 (12,440) (11,926) 7,000 6,886 5,832 5,753 1,342 1,398 78 36 1,275 1,659 Total assets $ 27,250 $ 25,793 $ 613 $ 1,552 1,301 Liabilities Current liabilities Short-term borrowings and current portion of long-term debt Accounts payable Accrued payroll Accrued income taxes Other current liabilities Total current liabilities Long-term debt 1,453 680 644 252 350 1,899 4,897 5,097 1,992 5,839 5,166 2,227 Pension and postretirement benefits Other liabilities 1,727 2,847 1,637 15,489 Total liabilities 13,948 9 9 Equity 3M Company shareholders' equity: Common stock, par value $.01 per share; Additional paid-in capital Retained earnings Treasury stock Accumulated other comprehensive income (loss) Total 3M Company shareholders' equity Noncontrolling interest Total equity Total liabilities and equity 3,153 3,006 23,753 22,227 (10,397) (11,676) (3,754) (3,686) 12,764 9,880 538 424 13,302 10,304 $ 27,250 $ 25,793 (a) Compute net operating profit after tax (NOPAT) for 2009. Assurne that the combined federal and statutory rate is: 36.1% (Round your answer to the nearest whole number.) 2009 NOPAT = 3360 ($ millions) (b) Compute net operating assets (NOA) for 2009 and 2008. Treat noncurrent Investments as a nonoperating item. 2009 NOA (5 millions) 2008 NOA = is millions) (C) Compute 3M's RNOA, net operating profit margin (NOPM) and net operating asset turnover (NOAT) for 2009. (Round your answers to two decimal places, Do not use NOPM X NOAT to calculate RNOA) 2009 RNOA 90 2009 NOPM = 14.53 2009 NOAT (d) Compute net nonoperating obligations (NNO) for 2009 and 2008. 2009 NNO = ($ millions) 2008 NNO - ($ millions) (e) Compute return on equity (ROE) for 2009. (Round your answers to two decimal places. Do not round until your final answer.) 2009 ROE 96 (f) What is the nonoperating return component of ROE for 20097 (Round your answers to two decimal places.) 2009 nonoperating return = Analysis and Interpretation of Profitability Balance sheets and income statements for 3M Company follow. Consolidated Statements of Income Years ended December 31 ($ millions) 2009 2008 2007 Net sales $23,123 $25,269 $24,462 Operating expenses Cost of sales 12,109 13,379 12,735 Selling, general and administrative expenses 4,907 5,245 5,015 Research, development and related expenses 1,293 1,404 1,368 Loss/(gain) from sale of business 23 (849) Total operating expenses 18,309 20,051 18,269 Operating income 4,814 5,218 6,193 Interest expenses and income Interest expense 219 215 210 Interest income (37) (105) (132) Total interest expense 182 78 Income before income taxes 4,632 5,108 6,115 Provision for income taxes 1,388 1,588 1,964 Net income including noncontrolling interest 3,244 3,520 4,151 Less: Net income attributable to noncontrolling interest 51 60 55 Net income $ 3,193 $3,460 $ 4,096 110 2009 2008 $ 1,849 $ 3,040 744 373 3,250 3,195 1,255 1,505 815 851 569 657 Consolidated Balance Sheets ($ millions) Assets Current Assets Cash and cash equivalents Marketable securities-current Accounts receivable-net Inventories Finished goods Work in process Raw materials and supplies Total inventories Other current assets Total current assets Marketable securities-noncurrent Investments Property, plant and equipment Less: Accumulated depreciation Property, plant and equipment-net Goodwill Intangible assets-net Prepaid pension benefits Other assets 2,639 1,122 10,795 825 3,013 1,168 9,598 352 103 111 19,440 18,812 (12,440) (11,926) 7,000 6,886 5,832 5,753 1,342 1,398 78 36 1,275 1,659 Total assets $ 27,250 $ 25,793 $ 613 $ 1,552 1,301 Liabilities Current liabilities Short-term borrowings and current portion of long-term debt Accounts payable Accrued payroll Accrued income taxes Other current liabilities Total current liabilities Long-term debt 1,453 680 644 252 350 1,899 4,897 5,097 1,992 5,839 5,166 2,227 Pension and postretirement benefits Other liabilities 1,727 2,847 1,637 15,489 Total liabilities 13,948 9 9 Equity 3M Company shareholders' equity: Common stock, par value $.01 per share; Additional paid-in capital Retained earnings Treasury stock Accumulated other comprehensive income (loss) Total 3M Company shareholders' equity Noncontrolling interest Total equity Total liabilities and equity 3,153 3,006 23,753 22,227 (10,397) (11,676) (3,754) (3,686) 12,764 9,880 538 424 13,302 10,304 $ 27,250 $ 25,793 (a) Compute net operating profit after tax (NOPAT) for 2009. Assurne that the combined federal and statutory rate is: 36.1% (Round your answer to the nearest whole number.) 2009 NOPAT = 3360 ($ millions) (b) Compute net operating assets (NOA) for 2009 and 2008. Treat noncurrent Investments as a nonoperating item. 2009 NOA (5 millions) 2008 NOA = is millions) (C) Compute 3M's RNOA, net operating profit margin (NOPM) and net operating asset turnover (NOAT) for 2009. (Round your answers to two decimal places, Do not use NOPM X NOAT to calculate RNOA) 2009 RNOA 90 2009 NOPM = 14.53 2009 NOAT (d) Compute net nonoperating obligations (NNO) for 2009 and 2008. 2009 NNO = ($ millions) 2008 NNO - ($ millions) (e) Compute return on equity (ROE) for 2009. (Round your answers to two decimal places. Do not round until your final answer.) 2009 ROE 96 (f) What is the nonoperating return component of ROE for 20097 (Round your answers to two decimal places.) 2009 nonoperating return =Step by Step Solution
There are 3 Steps involved in it
Step: 1

Get Instant Access to Expert-Tailored Solutions
See step-by-step solutions with expert insights and AI powered tools for academic success
Step: 2

Step: 3
Ace Your Homework with AI
Get the answers you need in no time with our AI-driven, step-by-step assistance
Get Started
Financial management theory and practice
Authors: Eugene F. Brigham and Michael C. Ehrhardt
12th Edition
978-0030243998, 30243998, 324422695, 978-0324422696