I need the answer in yellow color.
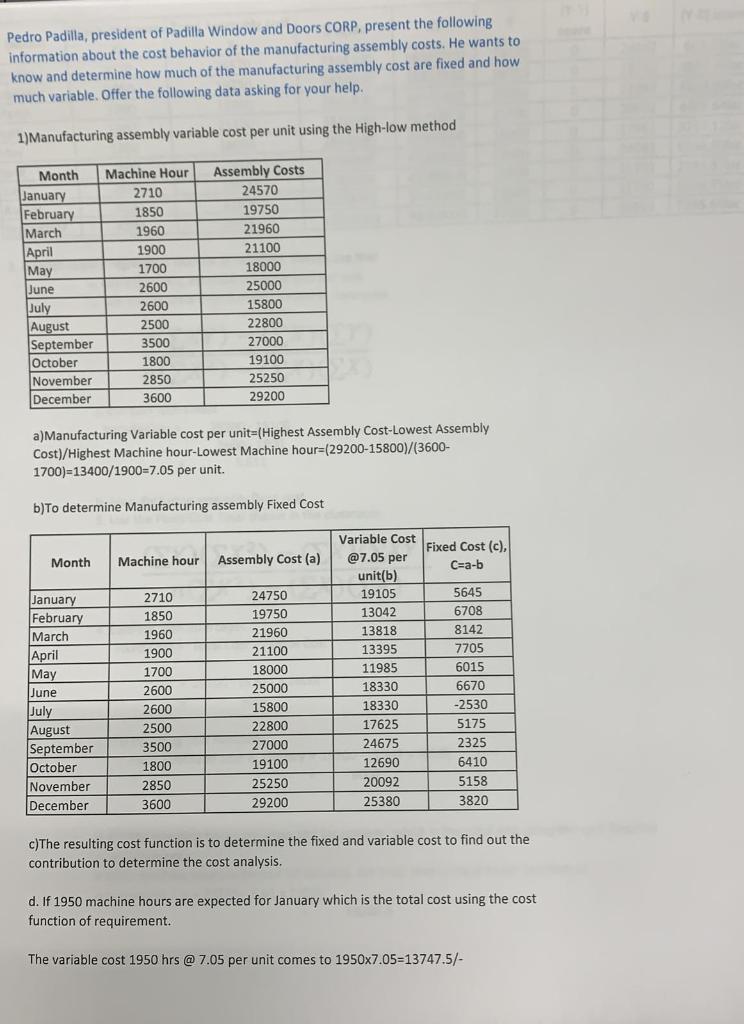
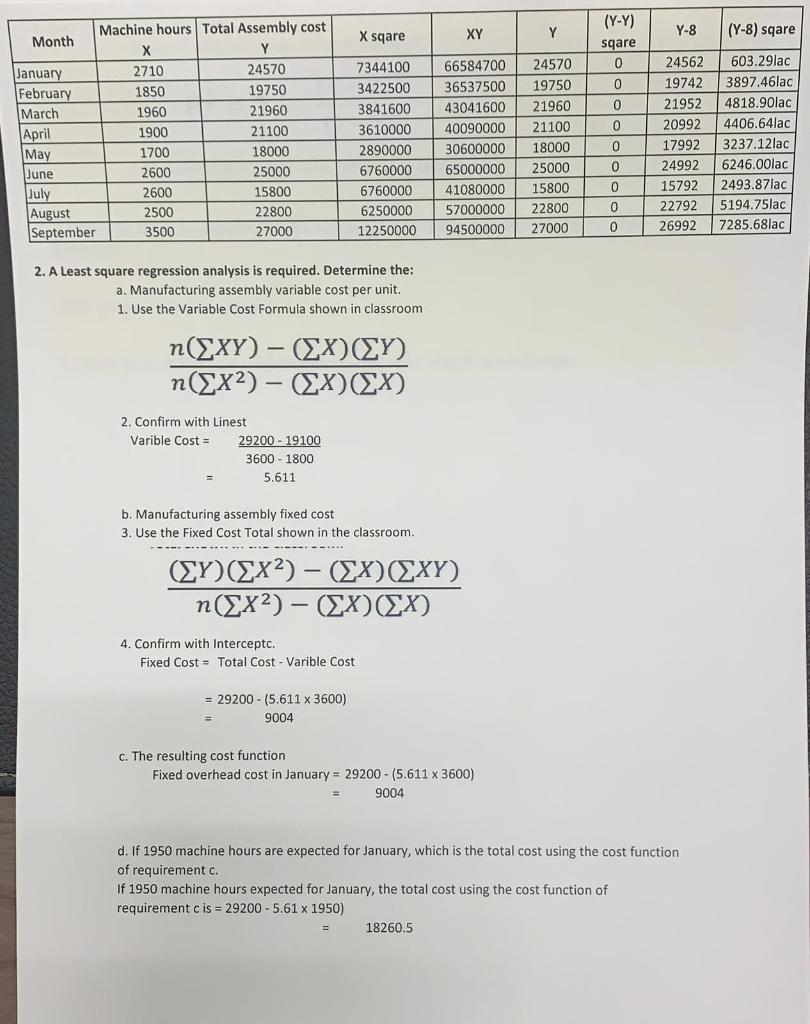

Pedro Padilla, president of Padilla Window and Doors CORP, present the following information about the cost behavior of the manufacturing assembly costs. He wants to know and determine how much of the manufacturing assembly cost are fixed and how much variable. Offer the following data asking for your help. 1)Manufacturing assembly variable cost per unit using the High-low method Month January February March April May June July August September October November December Machine Hour 2710 1850 1960 1900 1700 2600 2600 2500 3500 1800 2850 3600 Assembly Costs 24570 19750 21960 21100 18000 25000 15800 22800 27000 19100 25250 29200 a)Manufacturing Variable cost per unit=(Highest Assembly Cost-Lowest Assembly Cost)/Highest Machine hour-Lowest Machine hour=(29200-15800)/(3600- 1700)=13400/1900=7.05 per unit. b)To determine Manufacturing assembly Fixed Cost Month Machine hour Assembly Cost (a) January February March April May June July August September October November December 2710 1850 1960 1900 1700 2600 2600 2500 3500 1800 2850 3600 24750 19750 21960 21100 18000 25000 15800 22800 27000 19100 25250 29200 Variable Cost Fixed Cost (c), @7.05 per C=a-b unit(b) 19105 5645 13042 6708 13818 8142 13395 7705 11985 6015 18330 6670 18330 -2530 17625 5175 24675 2325 12690 6410 20092 25380 3820 5158 c)The resulting cost function is to determine the fixed and variable cost to find out the contribution to determine the cost analysis. d. If 1950 machine hours are expected for January which is the total cost using the cost function of requirement. The variable cost 1950 hrs @ 7.05 per unit comes to 1950x7.05-13747.5/- XY X sqare Y Y-8 (Y-8) sqare (Y-Y) sqare 0 0 0 1960 0 Machine hours Total Assembly cost Month X January 2710 24570 February 1850 19750 March 21960 April 1900 21100 May 1700 18000 June 2600 25000 July 2600 15800 August 2500 22800 September 3500 27000 7344100 3422500 3841600 3610000 2890000 6760000 6760000 6250000 12250000 66584700 36537500 43041600 40090000 30600000 65000000 41080000 57000000 94500000 24570 19750 21960 21100 18000 25000 15800 22800 27000 0 24562 19742 21952 20992 17992 24992 15792 22792 26992 603.29lac 3897.46lac 4818.90lac 4406.64lac 3237.12lac 6246.00lac 2493.87lac 5194.75lac 7285.68lac 0 0 0 0 2. A Least square regression analysis is required. Determine the: a. Manufacturing assembly variable cost per unit. 1. Use the Variable Cost Formula shown in classroom () - ()() n(2x2) - (2X)(2X) 2. Confirm with Linest Varible Cost = 29200 - 19100 3600 - 1800 5.611 b. Manufacturing assembly fixed cost 3. Use the Fixed Cost Total shown in the classroom. -.--.-- )(2) - ()() (2)- ()() 4. Confirm with Interceptc. Fixed Cost = Total Cost - Varible Cost = 29200 - (5.611 X 3600) 9004 C. The resulting cost function Fixed overhead cost in January = 29200 - (5.611 X 3600) 9004 d. If 1950 machine hours are expected for January, which is the total cost using the cost function of requirement c. If 1950 machine hours expected for January, the total cost using the cost function of requirement c is = 29200 - 5.61 x 1950) 18260.5 3. Determine the goodness of fit a. Square R using the formula shown in classroom R2 = 1 - (Y-y)2 (Y-Y2 b. Interpret the least square result, indicating its limitations 4. Present the corresponding table with the required columns and the Excel Summary Output of the Regression. 5. Shows the formulas uses in Excel. 6. You can use additional papers in order to show calculations for all of the requirements. Pedro Padilla, president of Padilla Window and Doors CORP, present the following information about the cost behavior of the manufacturing assembly costs. He wants to know and determine how much of the manufacturing assembly cost are fixed and how much variable. Offer the following data asking for your help. 1)Manufacturing assembly variable cost per unit using the High-low method Month January February March April May June July August September October November December Machine Hour 2710 1850 1960 1900 1700 2600 2600 2500 3500 1800 2850 3600 Assembly Costs 24570 19750 21960 21100 18000 25000 15800 22800 27000 19100 25250 29200 a)Manufacturing Variable cost per unit=(Highest Assembly Cost-Lowest Assembly Cost)/Highest Machine hour-Lowest Machine hour=(29200-15800)/(3600- 1700)=13400/1900=7.05 per unit. b)To determine Manufacturing assembly Fixed Cost Month Machine hour Assembly Cost (a) January February March April May June July August September October November December 2710 1850 1960 1900 1700 2600 2600 2500 3500 1800 2850 3600 24750 19750 21960 21100 18000 25000 15800 22800 27000 19100 25250 29200 Variable Cost Fixed Cost (c), @7.05 per C=a-b unit(b) 19105 5645 13042 6708 13818 8142 13395 7705 11985 6015 18330 6670 18330 -2530 17625 5175 24675 2325 12690 6410 20092 25380 3820 5158 c)The resulting cost function is to determine the fixed and variable cost to find out the contribution to determine the cost analysis. d. If 1950 machine hours are expected for January which is the total cost using the cost function of requirement. The variable cost 1950 hrs @ 7.05 per unit comes to 1950x7.05-13747.5/- XY X sqare Y Y-8 (Y-8) sqare (Y-Y) sqare 0 0 0 1960 0 Machine hours Total Assembly cost Month X January 2710 24570 February 1850 19750 March 21960 April 1900 21100 May 1700 18000 June 2600 25000 July 2600 15800 August 2500 22800 September 3500 27000 7344100 3422500 3841600 3610000 2890000 6760000 6760000 6250000 12250000 66584700 36537500 43041600 40090000 30600000 65000000 41080000 57000000 94500000 24570 19750 21960 21100 18000 25000 15800 22800 27000 0 24562 19742 21952 20992 17992 24992 15792 22792 26992 603.29lac 3897.46lac 4818.90lac 4406.64lac 3237.12lac 6246.00lac 2493.87lac 5194.75lac 7285.68lac 0 0 0 0 2. A Least square regression analysis is required. Determine the: a. Manufacturing assembly variable cost per unit. 1. Use the Variable Cost Formula shown in classroom () - ()() n(2x2) - (2X)(2X) 2. Confirm with Linest Varible Cost = 29200 - 19100 3600 - 1800 5.611 b. Manufacturing assembly fixed cost 3. Use the Fixed Cost Total shown in the classroom. -.--.-- )(2) - ()() (2)- ()() 4. Confirm with Interceptc. Fixed Cost = Total Cost - Varible Cost = 29200 - (5.611 X 3600) 9004 C. The resulting cost function Fixed overhead cost in January = 29200 - (5.611 X 3600) 9004 d. If 1950 machine hours are expected for January, which is the total cost using the cost function of requirement c. If 1950 machine hours expected for January, the total cost using the cost function of requirement c is = 29200 - 5.61 x 1950) 18260.5 3. Determine the goodness of fit a. Square R using the formula shown in classroom R2 = 1 - (Y-y)2 (Y-Y2 b. Interpret the least square result, indicating its limitations 4. Present the corresponding table with the required columns and the Excel Summary Output of the Regression. 5. Shows the formulas uses in Excel. 6. You can use additional papers in order to show calculations for all of the requirements