

Question
I need the answer of full question. if you want to use you can use all of my 6 allowed questions out of 20 allowed
I need the answer of full question. if you want to use you can use all of my 6 allowed questions out of 20 allowed questions. but i need full answer please. and if its not possible for you to
answer all due to any constrain so i need answer of F. thank you.
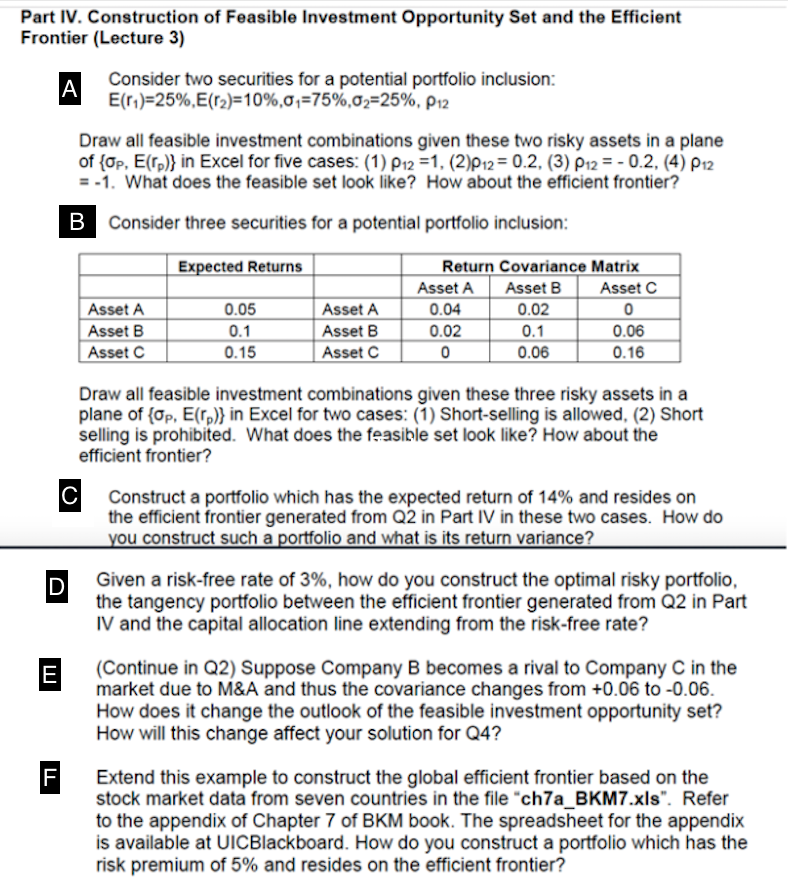
Part IV. Construction of Feasible Investment Opportunity Set and the Efficient Frontier (Lecture 3) Consider two securities for a potential portfolio inclusion: E(11)=25%,E(T2)=10%,0,=75%,02=25%, P12 Draw all feasible investment combinations given these two risky assets in a plane of {OP, E(rp)} in Excel for five cases: (1) P12 =1, (2)P12 = 0.2, (3) P12 = -0.2, (4) P12 = -1. What does the feasible set look like? How about the efficient frontier? B Consider three securities for a potential portfolio inclusion: Expected Returns Asset A Asset B Asset C 0.05 0.1 0.15 Asset A Asset B Asset C Return Covariance Matrix Asset A Asset B Asset C 0.04 0.02 0 0.02 0.1 0.06 0 0.06 0.16 C Draw all feasible investment combinations given these three risky assets in a plane of {Op, E(rp)} in Excel for two cases: (1) Short-selling is allowed, (2) Short selling is prohibited. What does the feasible set look like? How about the efficient frontier? Construct a portfolio which has the expected return of 14% and resides on the efficient frontier generated from Q2 in Part IV in these two cases. How do you construct such a portfolio and what is its return variance? Given a risk-free rate of 3%, how do you construct the optimal risky portfolio, the tangency portfolio between the efficient frontier generated from Q2 in Part IV and the capital allocation line extending from the risk-free rate? (Continue in Q2) Suppose Company B becomes a rival to Company C in the market due to M&A and thus the covariance changes from +0.06 to -0.06. How does it change the outlook of the feasible investment opportunity set? How will this change affect your solution for Q4? D E F Extend this example to construct the global efficient frontier based on the stock market data from seven countries in the file "ch7a_BKM7.xls". Refer to the appendix of Chapter 7 of BKM book. The spreadsheet for the appendix is available at UICBlackboard. How do you construct a portfolio which has the risk premium of 5% and resides on the efficient frontier? Part IV. Construction of Feasible Investment Opportunity Set and the Efficient Frontier (Lecture 3) Consider two securities for a potential portfolio inclusion: E(11)=25%,E(T2)=10%,0,=75%,02=25%, P12 Draw all feasible investment combinations given these two risky assets in a plane of {OP, E(rp)} in Excel for five cases: (1) P12 =1, (2)P12 = 0.2, (3) P12 = -0.2, (4) P12 = -1. What does the feasible set look like? How about the efficient frontier? B Consider three securities for a potential portfolio inclusion: Expected Returns Asset A Asset B Asset C 0.05 0.1 0.15 Asset A Asset B Asset C Return Covariance Matrix Asset A Asset B Asset C 0.04 0.02 0 0.02 0.1 0.06 0 0.06 0.16 C Draw all feasible investment combinations given these three risky assets in a plane of {Op, E(rp)} in Excel for two cases: (1) Short-selling is allowed, (2) Short selling is prohibited. What does the feasible set look like? How about the efficient frontier? Construct a portfolio which has the expected return of 14% and resides on the efficient frontier generated from Q2 in Part IV in these two cases. How do you construct such a portfolio and what is its return variance? Given a risk-free rate of 3%, how do you construct the optimal risky portfolio, the tangency portfolio between the efficient frontier generated from Q2 in Part IV and the capital allocation line extending from the risk-free rate? (Continue in Q2) Suppose Company B becomes a rival to Company C in the market due to M&A and thus the covariance changes from +0.06 to -0.06. How does it change the outlook of the feasible investment opportunity set? How will this change affect your solution for Q4? D E F Extend this example to construct the global efficient frontier based on the stock market data from seven countries in the file "ch7a_BKM7.xls". Refer to the appendix of Chapter 7 of BKM book. The spreadsheet for the appendix is available at UICBlackboard. How do you construct a portfolio which has the risk premium of 5% and resides on the efficient frontier
Step by Step Solution
There are 3 Steps involved in it
Step: 1

Get Instant Access to Expert-Tailored Solutions
See step-by-step solutions with expert insights and AI powered tools for academic success
Step: 2

Step: 3
Ace Your Homework with AI
Get the answers you need in no time with our AI-driven, step-by-step assistance
Get Started
Basic Finance An Introduction to Financial Institutions, Investments and Management
Authors: Herbert B. Mayo
11th Edition
1285425790, 1285425795, 9781305464988 , 978-1285425795