Answered step by step
Verified Expert Solution
Question
1 Approved Answer
I need the answer to be with the excel picturs TED Talk Presenters have asked for some insight into the most popular years of presentations
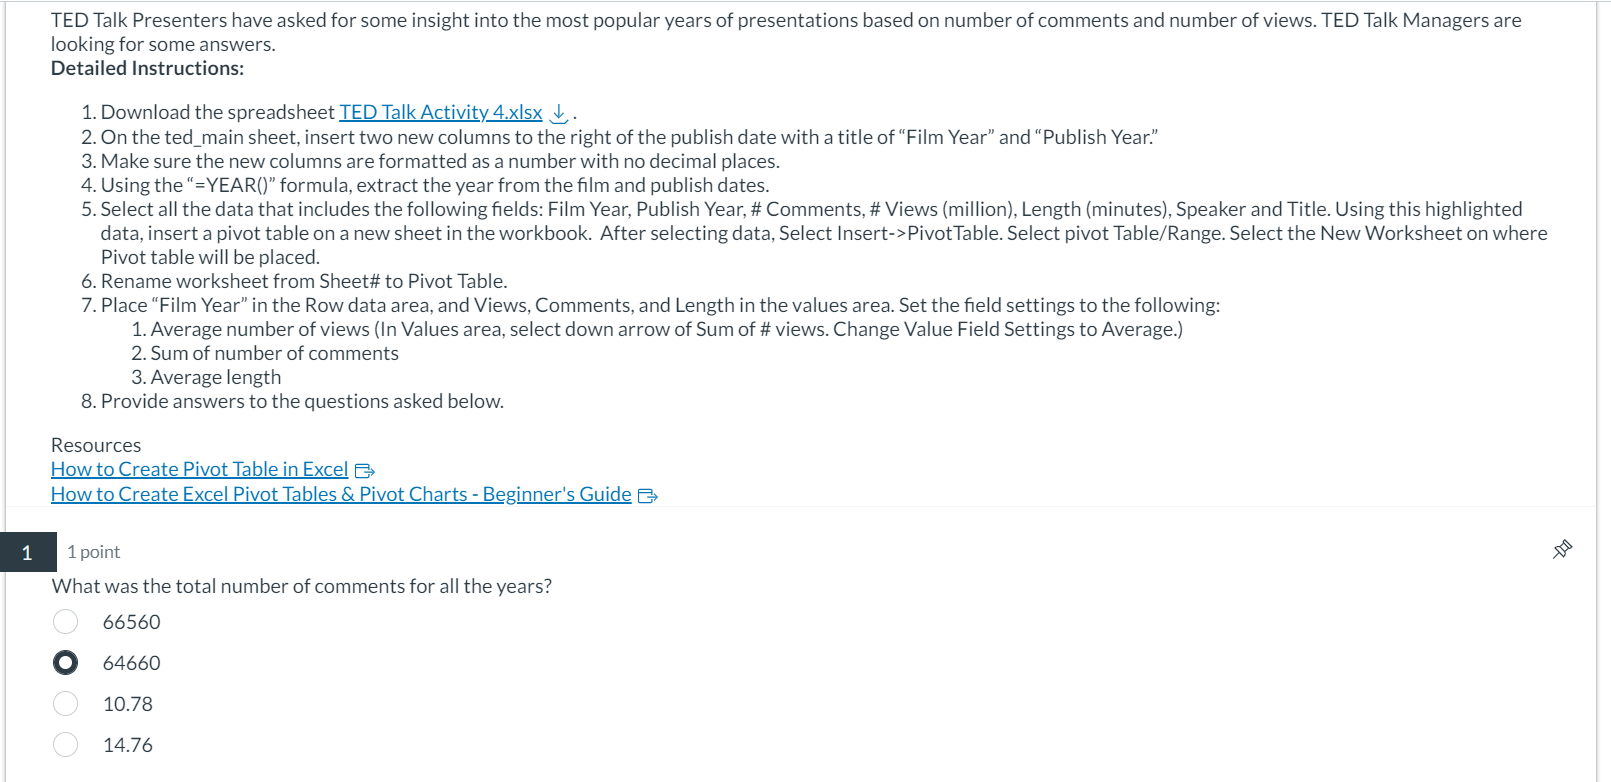
I need the answer to be with the excel picturs TED Talk Presenters have asked for some insight into the most popular years of presentations based on number of comments and number of views. TED Talk Managers are
looking for some answers.
Detailed Instructions:
On the tedmain sheet, insert two new columns to the right of the publish date with a title of "Film Year" and "Publish Year."
Make sure the new columns are formatted as a number with no decimal places.
Using the YEAR formula, extract the year from the film and publish dates.
Select all the data that includes the following fields: Film Year, Publish Year, # Comments, # Views million Length minutes Speaker and Title. Using this highlighted
data, insert a pivot table on a new sheet in the workbook. After selecting data, Select InsertPivotTable. Select pivot TableRange Select the New Worksheet on where
Pivot table will be placed.
Rename worksheet from Sheet# to Pivot Table.
Place "Film Year" in the Row data area, and Views, Comments, and Length in the values area. Set the field settings to the following:
Average number of views In Values area, select down arrow of Sum of # views. Change Value Field Settings to Average.
Sum of number of comments
Average length
Provide answers to the questions asked below.
Resources
How to Create Pivot Table in Excel es
How to Create Excel Pivot Tables & Pivot Charts Beginner's Guide
What was the total number of comments for all the years?

Step by Step Solution
There are 3 Steps involved in it
Step: 1

Get Instant Access to Expert-Tailored Solutions
See step-by-step solutions with expert insights and AI powered tools for academic success
Step: 2

Step: 3

Ace Your Homework with AI
Get the answers you need in no time with our AI-driven, step-by-step assistance
Get Started


