 I need the answers for abc ONLY, please use python language.
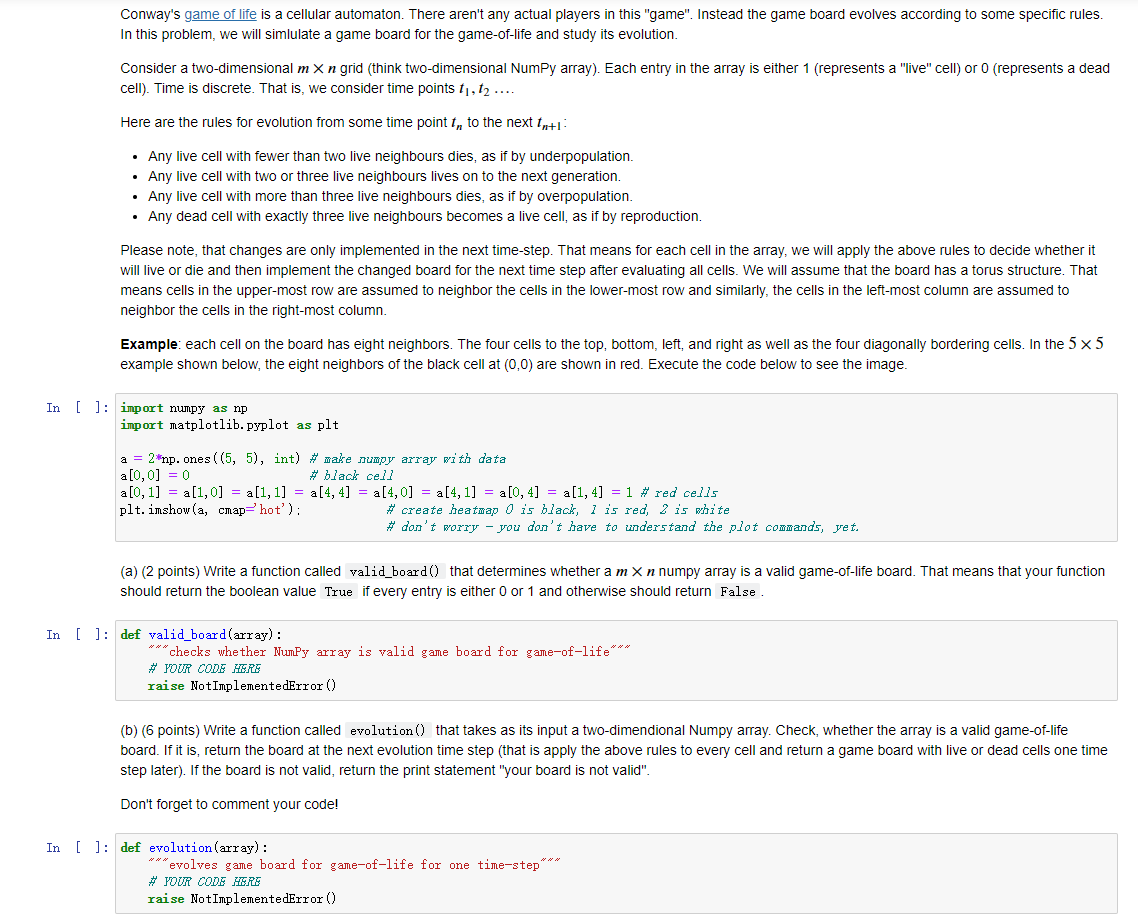
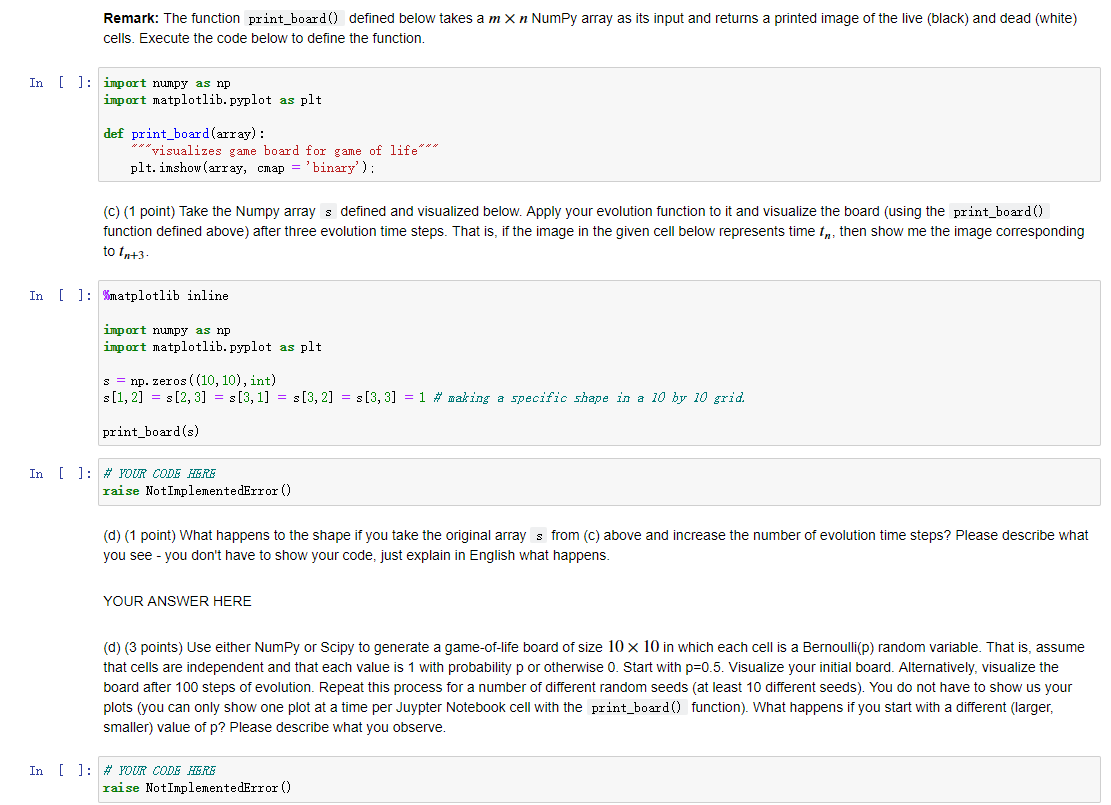
Conway's game of life is a cellular automaton. There aren't any actual players in this game". Instead the game board evolves according to some specific rules. In this problem, we will simlulate game board for the game-of-life and study its evolution. Consider a two-dimensional m X n grid (think two-dimensional Numpy array). Each entry in the array is either 1 (represents a "live" cell) or 0 (represents a dead cell). Time is discrete. That is, we consider time points 11, 12 .... Here are the rules for evolution from some time point in to the next Intl Any live cell with fewer than two live neighbours dies, as if by underpopulation. Any live cell with two or three live neighbours lives on to the next generation. Any live cell with more than three live neighbours dies, as if by overpopulation. Any dead cell with exactly three live neighbours becomes a live cell, as if by reproduction. Please note that changes are only implemented in the next time-step. That means for each cell in the array, we will apply the above rules to decide whether it will live or die and then implement the changed board for the next time step after evaluating all cells. We will assume that the board has a torus structure. That means cells in the upper-most row are assumed to neighbor the cells in the lower-most row and similarly, the cells in the left-most column are assumed to neighbor the cells in the right-most column. Example: each cell on the board has eight neighbors. The four cells to the top, bottom, left, and right as well as the four diagonally bordering cells. In the 5 x 5 example shown below, the eight neighbors of the black cell at (0,0) are shown in red. Execute the code below to see the image. In [ ]: import numpy as np import matplotlib. pyplot as plt a = 2*np. ones((5, 5), int) #mae pumpy array with data a[0,0] = 0 # black cell a[0, 1] = a[1,0] = a[1,1] = a[4, 4] = a[4,0] = a[4, 1] = a[0,4] = a[1, 4] = 1 # red cells plt. imshow(a, cmap='hot'); # create heatmap O is black, I is red, 2 is white # don't worry - you don't have to understand the plot commands, yet. (a) (2 points) Write a function called valid_board() that determines whether a m X n numpy array is a valid game-of-life board. That means that your function should return the boolean value True if every entry is either 0 or 1 and otherwise should return False In [ ]: def valid_board(array) : ****checks whether Numpy array is valid game board for game-of-life*** # YOUR CODE HERE raise Not ImplementedError() (b) (6 points) Write a function called evolution) that takes as its input a two-dimendional Numpy array. Check, whether the array is a valid game-of-life board. If it is, return the board at the next evolution time step (that is apply the above rules to every cell and return a game board with live or dead cells one time step later). If the board is not valid, return the print statement "your board is not valid". Don't forget to comment your code! In [ ]: def evolution (array) : ***evolves game board for game-of-life for one time-step*** # YOUR CODE HERE raise NotImplementedError() Remark: The function print_board() defined below takes a m X n Numpy array as its input and returns a printed image of the live (black) and dead (white) cells. Execute the code below to define the function. In [ ]: import numpy as np import matplotlib. pyplot as plt def print_board (array): visualizes game board for game of life*** plt. imshow(array, chap = 'binary'); (c) (1 point) Take the Numpy array s defined and visualized below. Apply your evolution function to it and visualize the board (using the print_board() function defined above) after three evolution time steps. That is, if the image in the given cell below represents time t, then show me the image corresponding to 1+3 In [ ]: Smatplotlib inline import numpy as np import matplotlib.pyplot as plt s = np.zeros((10,10), int) $[1,2] = $ [2,3] = s[3,1] = s[3,2] = s[3,3] = 1 # making a specific shape in a 10 by 10 grid. print_board(s) In [ ]: # YOUR CODE HERE raise NotImplementedError() (d) (1 point) What happens to the shape if you take the original array s from (C) above and increase the number of evolution time steps? Please describe what you see - you don't have to show your code, just explain in English what happens. YOUR ANSWER HERE (d) (3 points) Use either Numpy or Scipy to generate a game-of-life board of size 10 x 10 in which each cell is a Bernoulli(p) random variable. That is, assume that cells are independent and that each value is 1 with probability por otherwise 0. Start with p=0.5. Visualize your initial board. Alternatively, visualize the board after 100 steps of evolution. Repeat this process for a number of different random seeds (at least 10 different seeds). You do not have to show us your plots (you can only show one plot at a time per Juypter Notebook cell with the print_board() function). What happens if you start with a different (larger, smaller) value of p? Please describe what you observe. In [ ]: # YOUR CODE HERE raise NotImplementedError()