I need the codes in language R please!
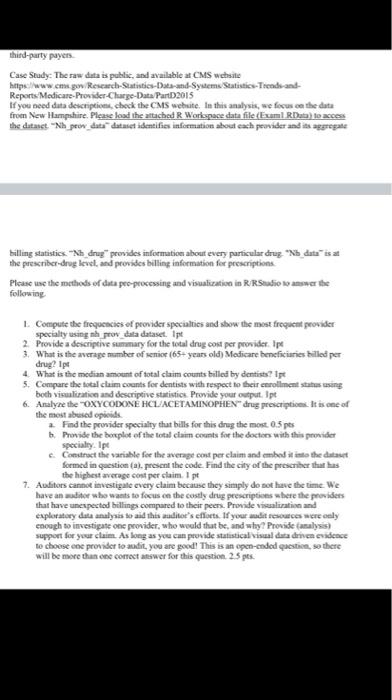
third-party payers Case Study: The raw data is public, and available at CMS website https://www.cm.gor Research Statistics Data and System Statistics-Trends and Reports Medicare Provider-Clure-Data PantD2015 If you need data description, check the CMS website. In this analysis, we focus on the date from New Hampshire. Please load the attached R Workspace data file (Examl RDuta) to access the dataset. "Nh_prow_data" dataset identifies information about each provider and its aggregate Filling statistics "Nh drug provides information about every particular drug" data" is at the prescriber-drug level and provides billing information for prescriptions Please use the methods of data pro-processing and visualization in R Radiolo were following 1. Compute the frequencies of provider specialties and show the most frequent peovider specialty using the prov data dataset. Ipt 2. Provide a descriptive summary for the total drug cost per provider.Ipe 3. What is the average number of semio (65+ years old) Medicare beneficiaries billeder drug? Ipt 4. What is the median amount of total claim counts billed by dentists? It 5. Compare the total claim counts for dentists with respect to their enrollment status song both visualization and descriptive statistics Provide your output. Ipt 6. Analyze the OXYCODONE HCL ACETAMINOPHEN drug prescription. It is one of the most abused opioids 2. Find the provider specialty that bills for this drug the most 0.5 pts h Provide the borplot of the total claim counts for the doctors with this provider Specialty lpe Contract the variable for the average cost per claim and embed it into the dataset formed in question (al present the code. Find the city of the prescriber that has the highest average cost per claim. 1 pt 7. Auditors cannot investigate every claim because they simply do not have the time. We have and who wants to focus on the costly drug prescriptions where the providers that have unexpected billing compared to their peers. Provide valand exploratory data analysis to aid this auditor's efforts. If your mit resources were only enough to investigate one provider, who would that be, and why? Provide analysis) support for your claim. As long as you can provide statistical visual dat die evidence to choose one provider to audit you are good! This is an open-ended question, so there will be more than one correct answer for this question 2.5 pes. third-party payers Case Study: The raw data is public, and available at CMS website https://www.cm.gor Research Statistics Data and System Statistics-Trends and Reports Medicare Provider-Clure-Data PantD2015 If you need data description, check the CMS website. In this analysis, we focus on the date from New Hampshire. Please load the attached R Workspace data file (Examl RDuta) to access the dataset. "Nh_prow_data" dataset identifies information about each provider and its aggregate Filling statistics "Nh drug provides information about every particular drug" data" is at the prescriber-drug level and provides billing information for prescriptions Please use the methods of data pro-processing and visualization in R Radiolo were following 1. Compute the frequencies of provider specialties and show the most frequent peovider specialty using the prov data dataset. Ipt 2. Provide a descriptive summary for the total drug cost per provider.Ipe 3. What is the average number of semio (65+ years old) Medicare beneficiaries billeder drug? Ipt 4. What is the median amount of total claim counts billed by dentists? It 5. Compare the total claim counts for dentists with respect to their enrollment status song both visualization and descriptive statistics Provide your output. Ipt 6. Analyze the OXYCODONE HCL ACETAMINOPHEN drug prescription. It is one of the most abused opioids 2. Find the provider specialty that bills for this drug the most 0.5 pts h Provide the borplot of the total claim counts for the doctors with this provider Specialty lpe Contract the variable for the average cost per claim and embed it into the dataset formed in question (al present the code. Find the city of the prescriber that has the highest average cost per claim. 1 pt 7. Auditors cannot investigate every claim because they simply do not have the time. We have and who wants to focus on the costly drug prescriptions where the providers that have unexpected billing compared to their peers. Provide valand exploratory data analysis to aid this auditor's efforts. If your mit resources were only enough to investigate one provider, who would that be, and why? Provide analysis) support for your claim. As long as you can provide statistical visual dat die evidence to choose one provider to audit you are good! This is an open-ended question, so there will be more than one correct answer for this question 2.5 pes