Answered step by step
Verified Expert Solution
Question
1 Approved Answer
I need the company I need to fill up the table where it shown ( company)and the roles and calculations for each one Comprehensive Problems
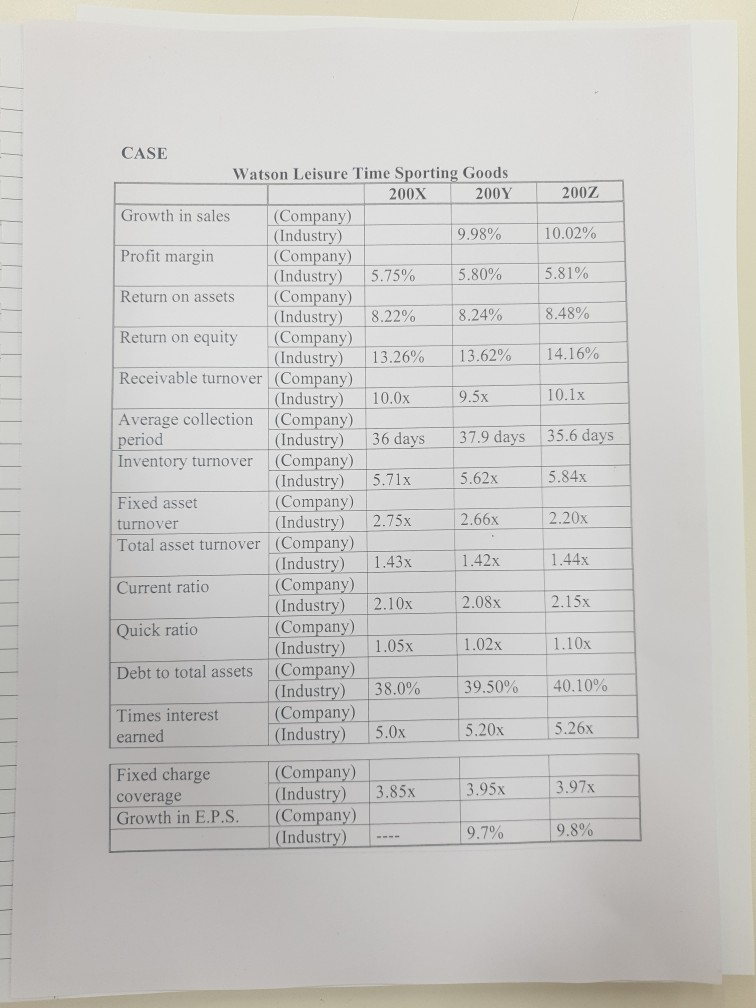
I need the company
I need to fill up the table where it shown ( company)and the roles and calculations for each one
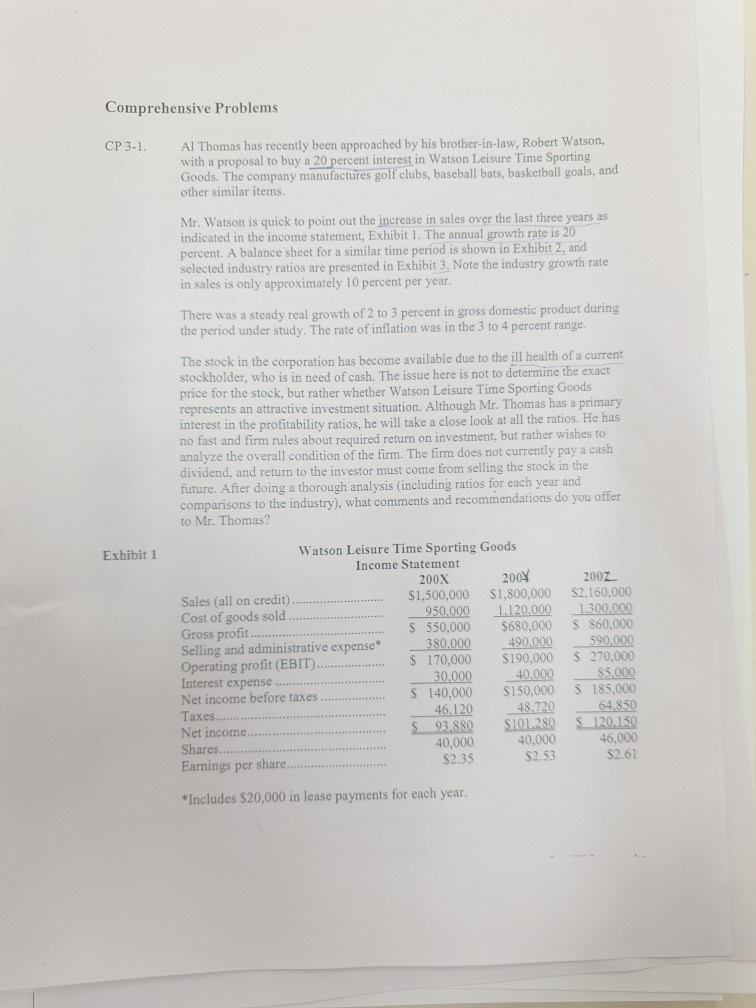
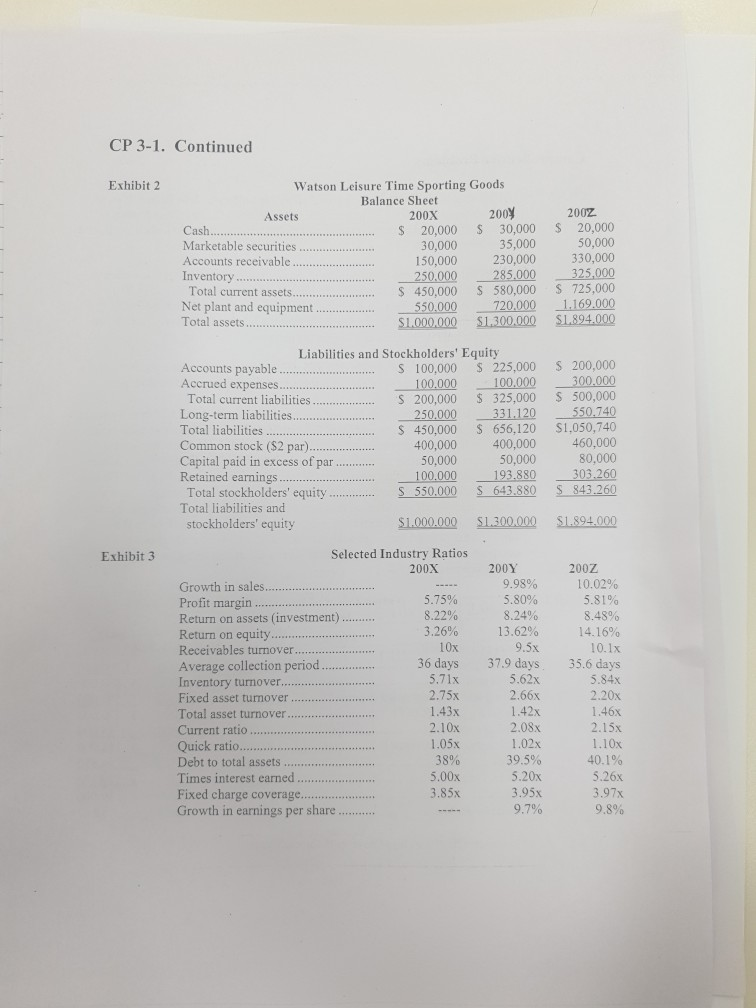
Comprehensive Problems Al Thomas has recently been approached by his brother-in-law, Robert Watson, with a proposal to buy a 20 percent interest in Watson Leisure Time Sporting Goods. The company manufactures golf clubs, baseball bats, basketball goals, and other similar items. CP3-1. Mr. Watson is quick to point out the increase in sales over the last three years as indicated in the income statement, Exhibit 1. The annual growth rate is 20 percent. A balance sheet for a similar time period is shown in Exhibit 2, and selected industry ratios are presented in Exhibit 3. Note the industry growth rate in sales is only approximately 10 percent per year. There was a steady real growth of 2 to 3 percent in gross domestic product during the period under study. The rate of inflation was in the 3 to 4 percent range stock in the corporation has become available due to the ill health of a current stockholder, who is in need of cash. The issue here is not to determine the exact price for the stock, but rather whether Watson Leisure Time Sporting Goods represents an attractive investment situation. Although Mr. Thomas has a primary interest in the profitability ratios, he will take a close look at all the ratios. He has ast and firm rules about required return on investment, but rather wishes to no f analyze the overall condition of the firm. The firm does not currently pay a cash dividend, and return to the investor must come from selling the stock in the future. After doing a thorough analysis (including ratios for each year and comparisons to the industry), what comments and recommendations do you offer to Mr. Thomas? Watson Leisure Time Sporting Goods Income Statement Exhibit 1 200X 200 2007 $1,500,000 $1,800,000 S2.160,000 950,000 1.120,0001300.000 S550,000 $680,000 S 860,000 tive expense380.000 40,000 90.000 S 170,000 $190,000 270,000 Sales (all on credit Cost of goods sold Selling and Operating profit (EBIT .. Interest expense. 0,000 40,000 46.120 48.720 40,000 $150,000 S 185.000 Net income before taxes 140,000 Taxes.. Net income S 93.880 101280 $ 120.150 46,000 40,000 S2.35 S2.53 $2.61 Includes $20,000 in lease payments for each year CP 3-1. Continued Watson Leisure Time Sporting Goods Balance Sheet Exhibit 2 Assets 200X 200Z Cash.. Marketable securities . 20,000 S 30,000 35,000 20,000 50,000 330,000 30,000 150,000 250,000 eivable 230,000 Inventory 450,000 580,000 725,000 S1000,000 300.000 S1894000 100,000 S 225,000 S 200,000 200,000 325,000 S 500,000 Total current assets.... Net plant and equipment. Total assets Liabilities and Stockholders' Equity Accounts payable. Accrued expenses.. 100,000 ities.. Long-term liabilities.. Total liabilities Common stock ($2 pr Capital paid in excess of par Retained eanings. S 450,000 S 656,120 $1,050,740 400,000 400,000 460,000 80,000 100.000 193.880 303.260 S 550.000 S 643.880 S 843.260 50,000 50,000 Total stockholders' equity Total liabilities and stockholders' equity S1.000.000 1300.000 S1894000 Exhibit 3 Selected Industry Ratios 200X 200Y 200z 9.98% 5.80% 10.02% Growth in sales Profit margin Return on assets (investment)... Return on equity. Re Average collection period.. Inventory turnover Fixed asset turnover Total asset turnover.. Current ratio Quick rati 5.81% 8.48% 14.16% 10.1x 35.6 days 8.22% 3.26% 8.24% 13.62% 36 days 37.9 days 5.62x 2.66x 2.20x 2.08x2.15x 2.10x 3890 3.85x 1.02x 39.5% 5.20x 3.95x 9.7% 40.1% 5.26x Times interest earned.. Fixed charge coverage.... Growth in earnings per share. 9.8% CASE Watson Leisure Time Sporting Goods 200Y 200Z 10.02% 5.81% 8.48% | 14.16% 200X Growth in sales Company) Industry) 9.98% Profit margin Company) | 5.75% 18.22% | 13.26% (industry) | 5.80% Return on assets (Company) 8.24% |(Industry) (Company) | (industry) Return on equity | 13.62% Receivable turnover (Company) 9.5x Average collection (Company) period Inventory turnover (Company) Industry) 10.0x Industry) 36 days 37.9 days 35.6 days (Industry) 5.71x 5.62x 2.66x 1.42x 2.08x 1.02x 5.84x 2.20x 1.44x 2.15x 1.10x Fixed asset turnover Total asset turnover (Company) (Company) Industry) 2.75x 1.43x Industr Company) Industry) 2.10x Current ratio Quick ratio(Company) Industry) 1.05x Debt to total assets (Company) |(Industry) 140.10% 38.0% 39.50% Company) Industry) 5.0x Compan Industry)3.85x3.95x3.97x Times interest earned 5.26x Fixed charge coverage Growth in E.P.S. (Company) 9.7% 9.8% Industry)Step by Step Solution
There are 3 Steps involved in it
Step: 1

Get Instant Access to Expert-Tailored Solutions
See step-by-step solutions with expert insights and AI powered tools for academic success
Step: 2

Step: 3
Ace Your Homework with AI
Get the answers you need in no time with our AI-driven, step-by-step assistance
Get Started