I need the matlab code for this
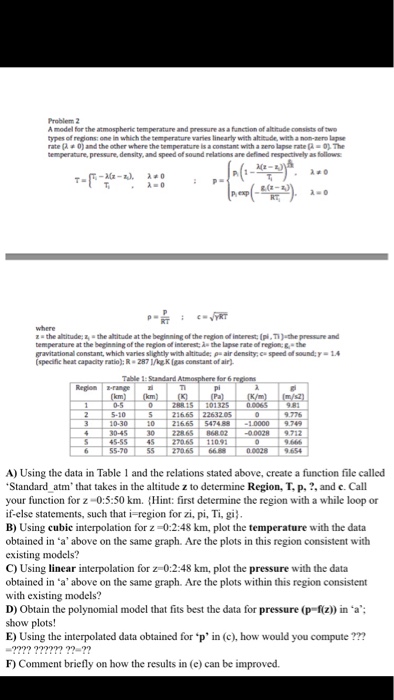
Problem 2 A model for the atmospheric temperature and pressure as a function of altihude consists of twe ypes of repions: one in which the temperature varies linearly with altitode, with a non-nero lapse rate (a0) and the other where the temperature is a constant with a ero lapse rate . 0). The emperature, pressure, density, and speed of sound relations are defined respectively as follows z a the altitude; a, the alhitude at the beginning of the region of interest (pi,Tuthe pressure and temperature at the beginning of the region of interest n the lagse rate of region g the gravitational constant, which varies slightly altitude; ?. air density: ca speed of sound; ?-1.4 (specific heat capacity ratio): R- 287kK gas constant of air) Table 1: Standard Atmosphere for 6 Region -range 0-S 5-10 10-30 216.65 22632 05 0 216.65 547488 30 2286 8680200028 9712 45 27065 11091 , 45-55 55-70 55 270.65 66 9446 A) Using the data in Table 1 and the relations stated above, create a function file called Standard atm' that takes in the altitude z to determine Region, T, p. ?, and c. Call your function for z-0:5:50 km. (Hint: first determine the region with a while loop or if-else statements, such that i-region for zi, pi, Ti, gil B) Using cubic interpolation for z -0:2:48 km, plot the temperature with the data obtained in a' above on the same graph. Are the plots in this region consistent with existing models? C) Using linear interpolation for z 0:2:48 km, plot the pressure with the data obtained in a above on the same graph. Are the plots within this region consistent with existing models? D) Obtain the polynomial model that fits best the data for pressure (p-f(z)) ?n 'a'; show plots! E) Using the interpolated data obtained for 'p' in (c), how would you compute ??m F) Comment briefly on how the results in (e) can be improved. Problem 2 A model for the atmospheric temperature and pressure as a function of altihude consists of twe ypes of repions: one in which the temperature varies linearly with altitode, with a non-nero lapse rate (a0) and the other where the temperature is a constant with a ero lapse rate . 0). The emperature, pressure, density, and speed of sound relations are defined respectively as follows z a the altitude; a, the alhitude at the beginning of the region of interest (pi,Tuthe pressure and temperature at the beginning of the region of interest n the lagse rate of region g the gravitational constant, which varies slightly altitude; ?. air density: ca speed of sound; ?-1.4 (specific heat capacity ratio): R- 287kK gas constant of air) Table 1: Standard Atmosphere for 6 Region -range 0-S 5-10 10-30 216.65 22632 05 0 216.65 547488 30 2286 8680200028 9712 45 27065 11091 , 45-55 55-70 55 270.65 66 9446 A) Using the data in Table 1 and the relations stated above, create a function file called Standard atm' that takes in the altitude z to determine Region, T, p. ?, and c. Call your function for z-0:5:50 km. (Hint: first determine the region with a while loop or if-else statements, such that i-region for zi, pi, Ti, gil B) Using cubic interpolation for z -0:2:48 km, plot the temperature with the data obtained in a' above on the same graph. Are the plots in this region consistent with existing models? C) Using linear interpolation for z 0:2:48 km, plot the pressure with the data obtained in a above on the same graph. Are the plots within this region consistent with existing models? D) Obtain the polynomial model that fits best the data for pressure (p-f(z)) ?n 'a'; show plots! E) Using the interpolated data obtained for 'p' in (c), how would you compute ??m F) Comment briefly on how the results in (e) can be improved