Answered step by step
Verified Expert Solution
Link Copied!

Question

1 Approved Answer

I need the post- hoc test interpreted please. I asked this same question yesterday and the answer I got was incorrect. My professor said that

I need the post- hoc test interpreted please. I asked this same question yesterday and the answer I got was incorrect. My professor said that all 3 means are not significantly different and to look at the p values. Help please :)
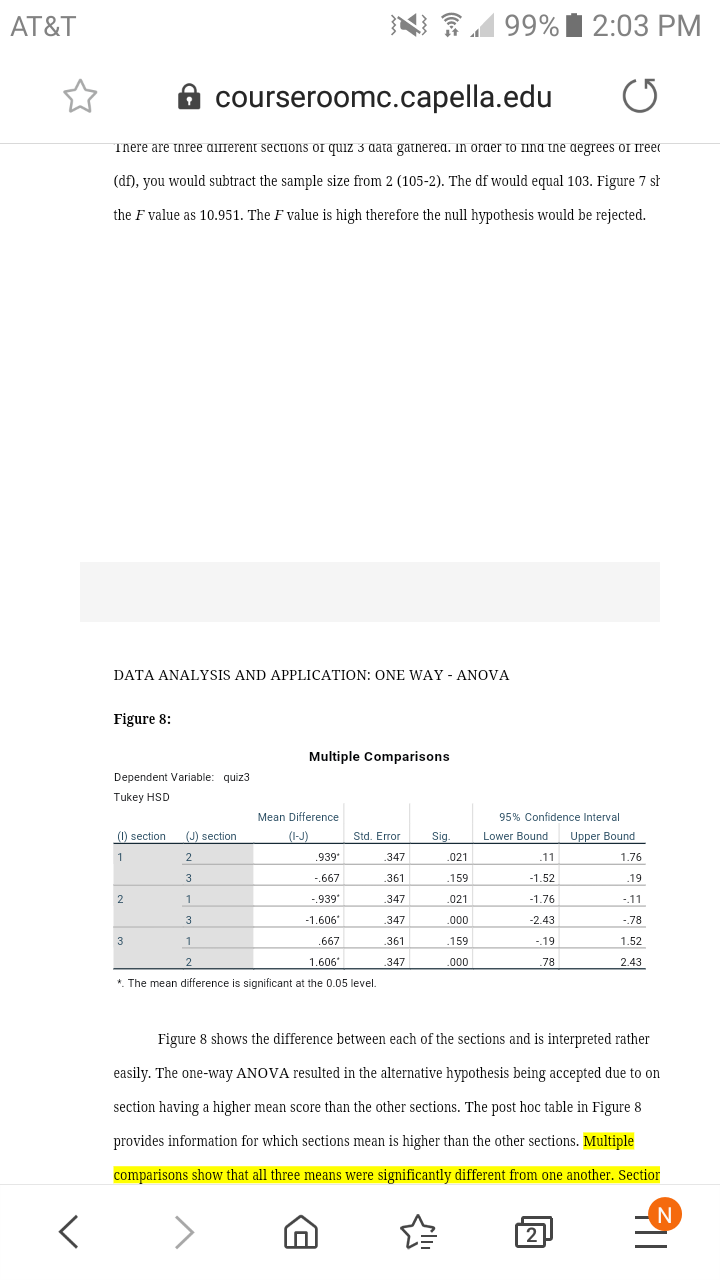
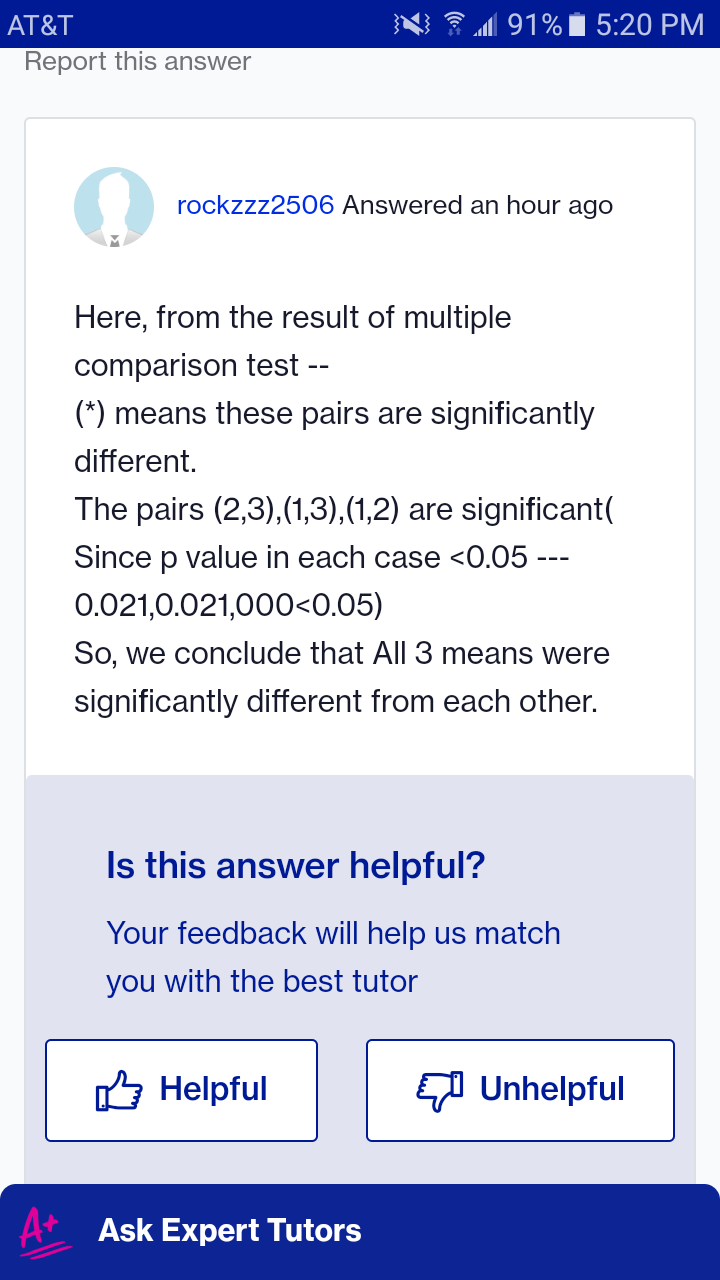
image text in transcribedimage text in transcribed
AT&T 3 99% 2:03 PM & courseroomc.capella.edu There are three different sections of quiz 3 data gathered. In order to find the degrees of freed (df), you would subtract the sample size from 2 (105-2). The of would equal 103. Figure 7 st the F value as 10.951. The F value is high therefore the null hypothesis would be rejected. DATA ANALYSIS AND APPLICATION: ONE WAY - ANOVA Figure 8: Multiple Comparisons Dependent Variable: quiz3 Tukey HSD Mean Difference 95% Confidence Interval (0) section (J) section (1-J) Std. Error Sig. Lower Bound Upper Bound 2 939 .347 021 -11 1.76 3 -.667 .361 159 -1.52 .19 2 1 -.939 347 021 -1.76 -.11 3 -1.606' .347 .000 -2.43 -.78 3 1 667 361 159 -.19 1.52 1.606 .347 .000 -78 2.43 . The mean difference is significant at the 0.05 level. Figure 8 shows the difference between each of the sections and is interpreted rather easily. The one-way ANOVA resulted in the alternative hypothesis being accepted due to on section having a higher mean score than the other sections. The post hoc table in Figure 8 provides information for which sections mean is higher than the other sections. Multiple comparisons show that all three means were significantly different from one another. Sectionx '3 ...| 91 I 5:20 PM Report this answer rock2222508 Answered an hour ago I1 Here, from the result of multiple comparison test -- (*) means these pairs are significantly different. The pairs (2,3),(1,3),(1,2) are significant( Since p value in each case

Step by Step Solution

There are 3 Steps involved in it

Step: 1

blur-text-image

Get Instant Access to Expert-Tailored Solutions

See step-by-step solutions with expert insights and AI powered tools for academic success

Step: 2

blur-text-image

Step: 3

blur-text-image

Ace Your Homework with AI

Get the answers you need in no time with our AI-driven, step-by-step assistance

Get Started

Recommended Textbook for

Quantitative Analysis For Management

Authors: Barry Render, Ralph M. Stair, Michael E. Hanna

11th Edition

9780132997621, 132149117, 132997622, 978-0132149112

Students also viewed these Mathematics questions