Answered step by step
Verified Expert Solution
Question
1 Approved Answer
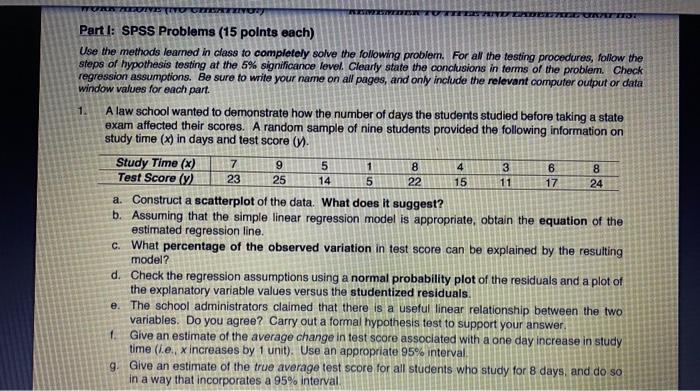
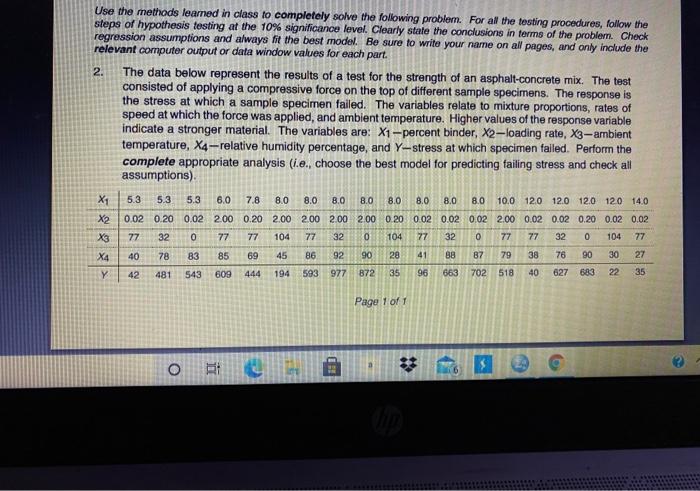
i need the spss outputs for these plss 14 TESTYIVORY Part I: SPSS Problems (15 points each) Use the methods learned in class to completely
i need the spss outputs for these plss 

14 TESTYIVORY Part I: SPSS Problems (15 points each) Use the methods learned in class to completely solve the following problem. For all the testing procedures, follow the steps of hypothesis testing at the 5% significance level. Clearly state the conclusions in terms of the problem. Check regression assumptions. Be sure to write your name on all pages, and only include the relevant computer output or data window values for each part. 1. A law school wanted to demonstrate how the number of days the students studied before taking a state exam affected their scores. A random sample of nine students provided the following information on study time (x) in days and test score (7) Study Time (x) 7 9 5 1 8 4 3 6 8 Test Score (y) 23 25 5 22 15 11 17 24 a. Construct a scatterplot of the data. What does it suggest? b. Assuming that the simple linear regression model is appropriate, obtain the equation of the estimated regression line. C. What percentage of the observed variation in test score can be explained by the resulting model? d. Check the regression assumptions using a normal probability plot of the residuals and a plot of the explanatory variable values versus the studentized residuals e The school administrators claimed that there is a useful linear relationship between the two variables. Do you agree? Carry out a formal hypothesis test to support your answer. 1 Give an estimate of the average change in test score associated with a one day increase in study time (ie, increases by 1 unit). Use an appropriate 95% interval g. Give an estimate of the true average test score for all students who study for 8 days, and do so in a way that incorporates a 95% interval Use the methods learned in class to completely solve the following problem. For all the testing procedures, follow the steps of hypothesis testing at the 10% significance level. Clearly state the conclusions in terms of the problem. Check regression assumptions and always fit the best model. Be sure to write your name on all pages, and only include the relevant computer output or data window values for each part. 2. The data below represent the results of a test for the strength of an asphalt-concrete mix. The test consisted of applying a compressive force on the top of different sample specimens. The response is the stress at which a sample specimen failed. The variables relate to mixture proportions, rates of speed at which the force was applied, and ambient temperature. Higher values of the response variable indicate a stronger material. The variables are: X1-percent binder, X2-loading rate, X3- ambient temperature, X4-relative humidity percentage, and Y-stress at which specimen failed. Perform the complete appropriate analysis (.e. choose the best model for predicting failing stress and check all assumptions) X1 5.3 5.3 5.3 6.0 7.8 8.0 8.0 8.0 8.0 8.0 8.0 8.0 10.0 12.0 12.0 12.0 120 14.0 X2 0.02 0.20 0.02 200 0.20 2.00 200 200 200 0 20 002 0.02 0.02 2.00 0.02 0.02 0.20 0.02 0.02 X3 77 32 0 77 77 104 77 32 0 104 77 32 0 77 77 32 0 77 X4 40 78 83 85 69 45 86 92 28 88 79 38 76 90 30 27 Y 42 481 543 609 444 194 593 977 872 35 96 663 702 518 40 627 683 22 35 80 104 90 41 87 Page 1 of 1 RI O *** 14 TESTYIVORY Part I: SPSS Problems (15 points each) Use the methods learned in class to completely solve the following problem. For all the testing procedures, follow the steps of hypothesis testing at the 5% significance level. Clearly state the conclusions in terms of the problem. Check regression assumptions. Be sure to write your name on all pages, and only include the relevant computer output or data window values for each part. 1. A law school wanted to demonstrate how the number of days the students studied before taking a state exam affected their scores. A random sample of nine students provided the following information on study time (x) in days and test score (7) Study Time (x) 7 9 5 1 8 4 3 6 8 Test Score (y) 23 25 5 22 15 11 17 24 a. Construct a scatterplot of the data. What does it suggest? b. Assuming that the simple linear regression model is appropriate, obtain the equation of the estimated regression line. C. What percentage of the observed variation in test score can be explained by the resulting model? d. Check the regression assumptions using a normal probability plot of the residuals and a plot of the explanatory variable values versus the studentized residuals e The school administrators claimed that there is a useful linear relationship between the two variables. Do you agree? Carry out a formal hypothesis test to support your answer. 1 Give an estimate of the average change in test score associated with a one day increase in study time (ie, increases by 1 unit). Use an appropriate 95% interval g. Give an estimate of the true average test score for all students who study for 8 days, and do so in a way that incorporates a 95% interval Use the methods learned in class to completely solve the following problem. For all the testing procedures, follow the steps of hypothesis testing at the 10% significance level. Clearly state the conclusions in terms of the problem. Check regression assumptions and always fit the best model. Be sure to write your name on all pages, and only include the relevant computer output or data window values for each part. 2. The data below represent the results of a test for the strength of an asphalt-concrete mix. The test consisted of applying a compressive force on the top of different sample specimens. The response is the stress at which a sample specimen failed. The variables relate to mixture proportions, rates of speed at which the force was applied, and ambient temperature. Higher values of the response variable indicate a stronger material. The variables are: X1-percent binder, X2-loading rate, X3- ambient temperature, X4-relative humidity percentage, and Y-stress at which specimen failed. Perform the complete appropriate analysis (.e. choose the best model for predicting failing stress and check all assumptions) X1 5.3 5.3 5.3 6.0 7.8 8.0 8.0 8.0 8.0 8.0 8.0 8.0 10.0 12.0 12.0 12.0 120 14.0 X2 0.02 0.20 0.02 200 0.20 2.00 200 200 200 0 20 002 0.02 0.02 2.00 0.02 0.02 0.20 0.02 0.02 X3 77 32 0 77 77 104 77 32 0 104 77 32 0 77 77 32 0 77 X4 40 78 83 85 69 45 86 92 28 88 79 38 76 90 30 27 Y 42 481 543 609 444 194 593 977 872 35 96 663 702 518 40 627 683 22 35 80 104 90 41 87 Page 1 of 1 RI O *** 

Step by Step Solution
There are 3 Steps involved in it
Step: 1

Get Instant Access to Expert-Tailored Solutions
See step-by-step solutions with expert insights and AI powered tools for academic success
Step: 2

Step: 3

Ace Your Homework with AI
Get the answers you need in no time with our AI-driven, step-by-step assistance
Get Started


