I need this due tomorrow morning, can anyone help me solving these questions? Any solution will be appreciated!
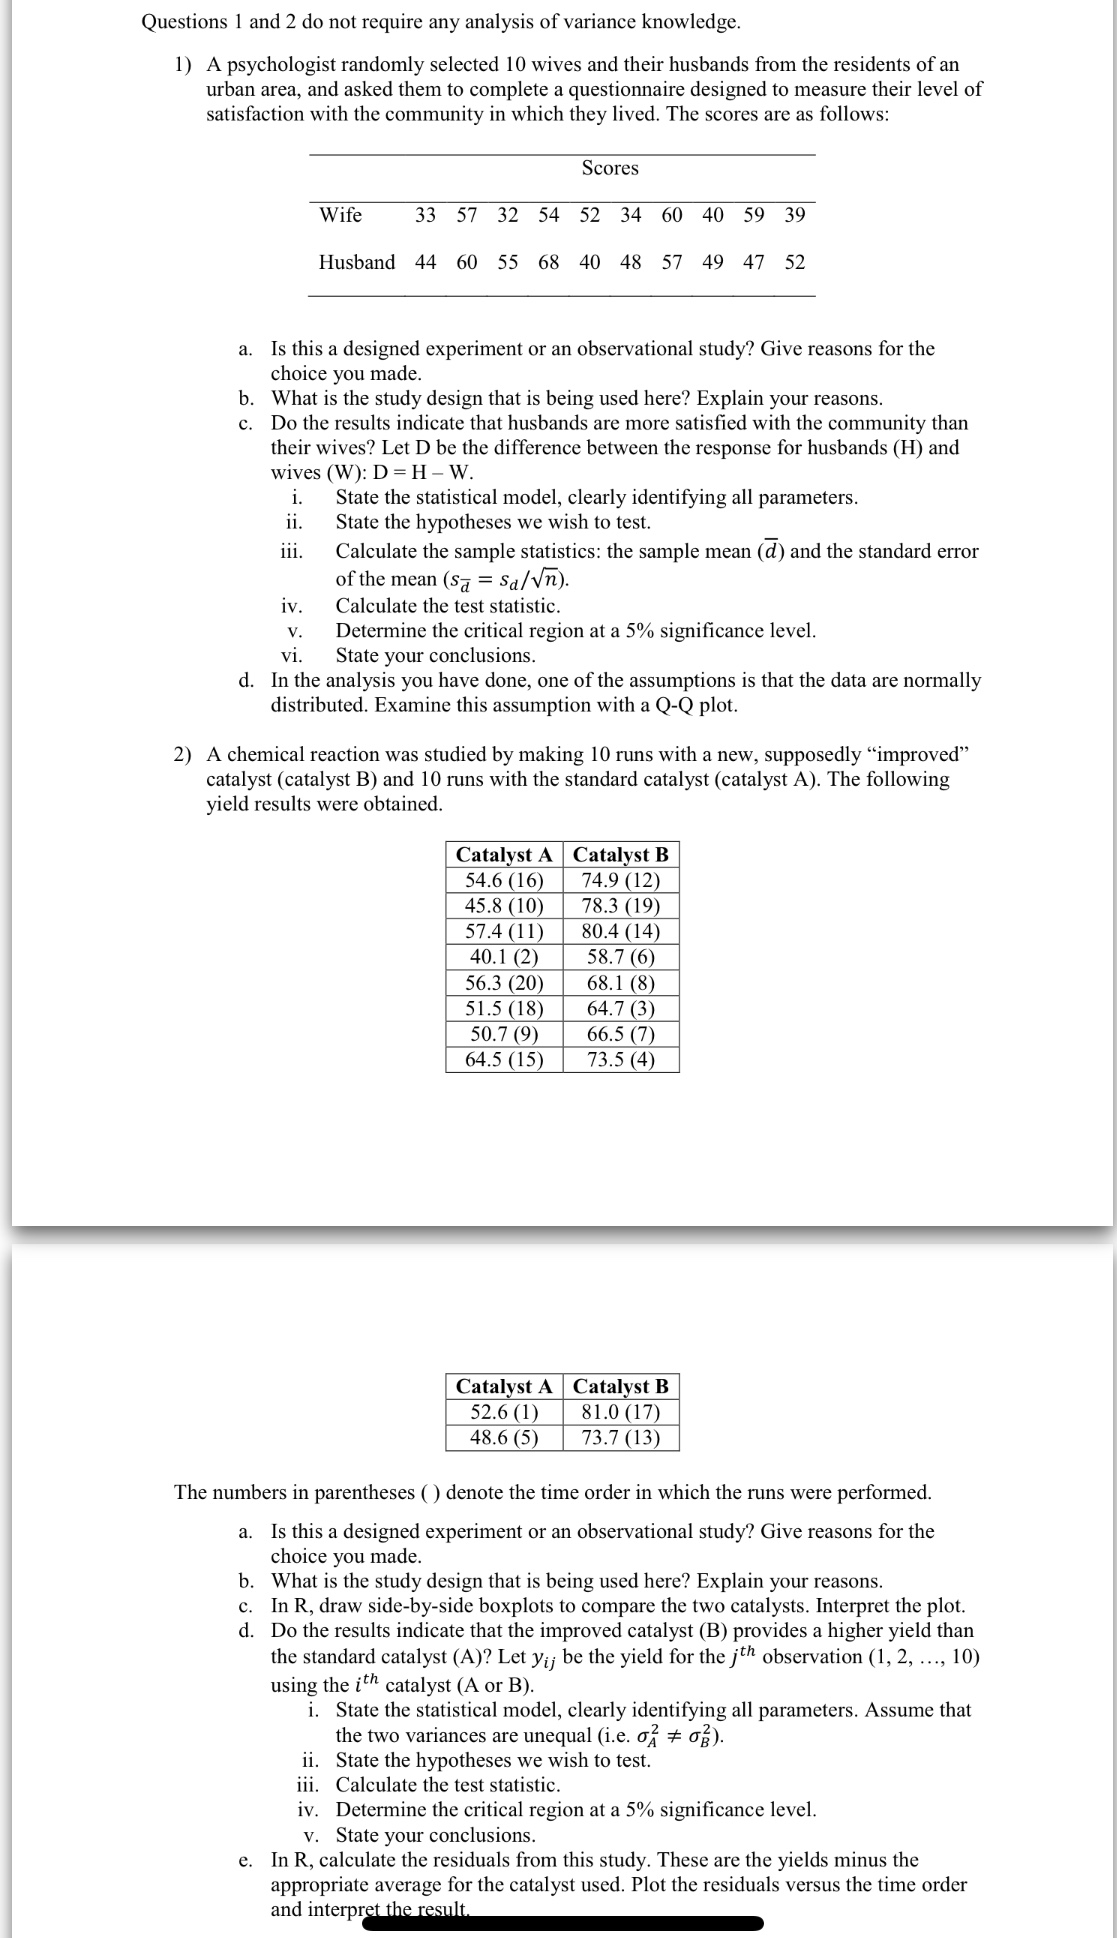
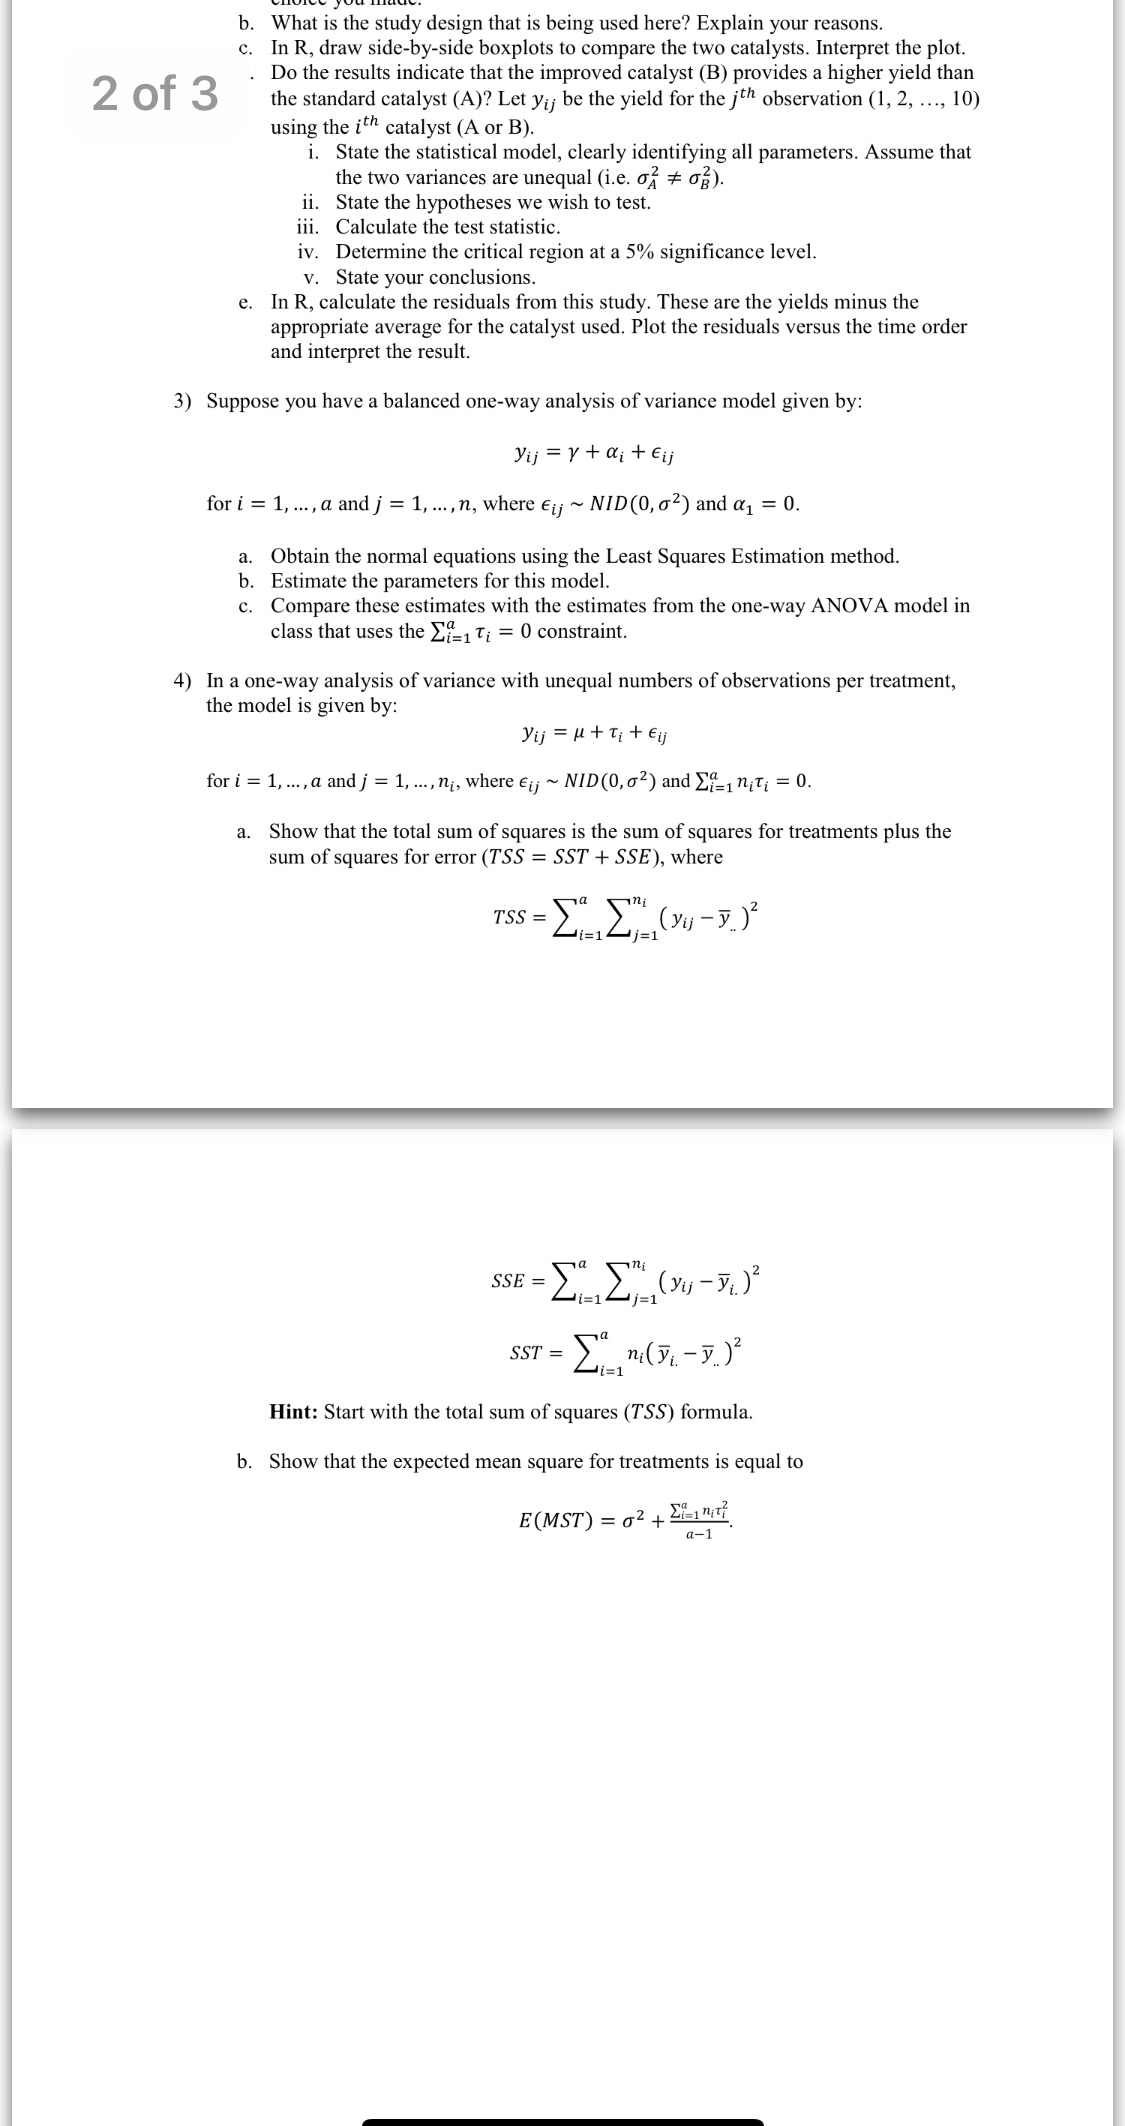
Questions 1 and 2 do not require any analysis of variance knowledge. 1) A psychologist randomly selected 10 wives and their husbands from the residents of an urban area, and asked them to complete a questionnaire designed to measure their level of satisfaction with the community in which they lived. The scores are as follows: Scores Wife 33 57 32 54 52 34 60 40 59 39 Husband 44 60 55 68 40 48 57 49 47 52 a. Is this a designed experiment or an observational study? Give reasons for the choice you made. b. What is the study design that is being used here? Explain your reasons. c. Do the results indicate that husbands are more satised with the community than their wives? Let D be the difference between the response for husbands (H) and wives (W): D = H W. i. State the statistical model, clearly identifying all parameters. ii. State the hypotheses we wish to test. iii. Calculate the sample statistics: the sample mean (E) and the standard error of the mean (SE = 5.1/43). iv. Calculate the test statistic. v. Determine the critical region at a 5% signicance level. vi. State your conclusions. d. In the analysis you have done, one of the assumptions is that the data are normally distributed. Examine this assumption with a Q-Q plot. 2) A chemical reaction was studied by making 10 runs with a new, supposedly \"improved\" catalyst (catalyst B) and 10 runs with the stande catalyst (catalyst A). The following yield results were obtained. CatalystB 74.902) 78.3(19) 80.404) 58.7(6) 68.1(8) 64-7 3 665(7) 735(4) Cats! stB 52.6(1) 31.0(17) 73.7 (13) The numbers in parentheses ( ) denote the time order in which the runs were performed. a. Is this a designed experiment or an observational study? Give reasons for the choice you made. b. What is the study design that is being used here? Explain your reasons. In R, draw side-by-side boxplots to compare the two catalysts. Interpret the plot. d. Do the results indicate that the improved catalyst (B) provides a higher yield than the standard catalyst (A)? Let y\" be the yield for the 1"" observation (1, 2, ..., 10) using the it\" catalyst (A or B). i. State the statistical model, clearly identifying all parameters. Assume that the two variances are unequal (i.e. of at :73). ii. State the hypotheses we wish to test. iii. Calculate the test statistic. iv. Determine the critical region at a 5% signicance level. v. State your conclusions. e. In R, calculate the residuals from this study. These are the yields minus the appropriate average for the catalyst used. Plot the residuals versus the time order and interpr iii iiilill P haulun Jun. nanny. b. What is the study design that is being used here? Explain your reasons. . In R, draw side-by-side boxplots to compare the two catalysts. Interpret the plot. . Do the results indicate that the improved catalyst (13) provides a higher yield than 2 Of 3 the standard catalyst (A)? Let yij be the yield for the j \"1 observation (1, 2, ..., 10) using the inil catalyst (A or B). i. State the statistical model, clearly identifying all parameters. Assume that the two Variances are unequal (1e. of 03). ii. State the hypotheses we wish to test. iii. Calculate the test statistic. iv. Determine the critical region at a 5% signicance level. v. State your conclusions e. In R, calculate the residuals from this study. These are the yields minus the appropriate average for the catalyst used. Plot the residuals versus the time order and interpret the result. 3) Suppose you have a balanced one-way analysis of variance model given by: yij=Y+ai+Eij fort" = 1,...,a andj = 1, ..,,n, where 6U ~ NJD(U,02) and a1 = U. a Obtain the normal equations using the Least Squares Estimation method. b. Estimate the parameters for this model. c. Compare these estimates with the estimates from the one-way ANOVA model in class that uses the Z?\" 1:; = 0 constraint. 4) In a one-way analysis of variance with unequal numbers of observations per treatment, the model is given by: 1V1] =F+T1+Eij fori = 1,....11 and] = 1,. ..,ni,where EiI' ~NID(D, 0'2) andz\" _1n,-1',- = 0. a. Show that the total sum of squares is the sum of squares for treatments plus the sum ofsquares for error (TSS = SST + SSE), where SSE: 2:132:1(3'U' yL) '1 _ _ 2 SST = 21-1 w. -y..) Hint: Start with the total sum of squares (TSS) formula. b. Show that the expected mean square for treatments is equal to


