Question
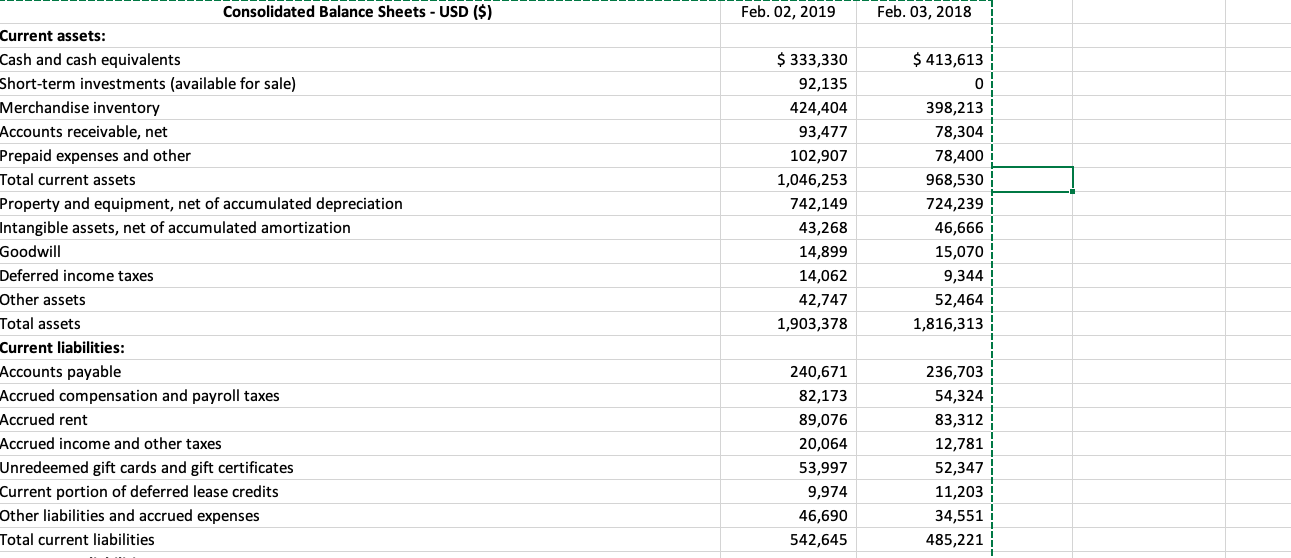
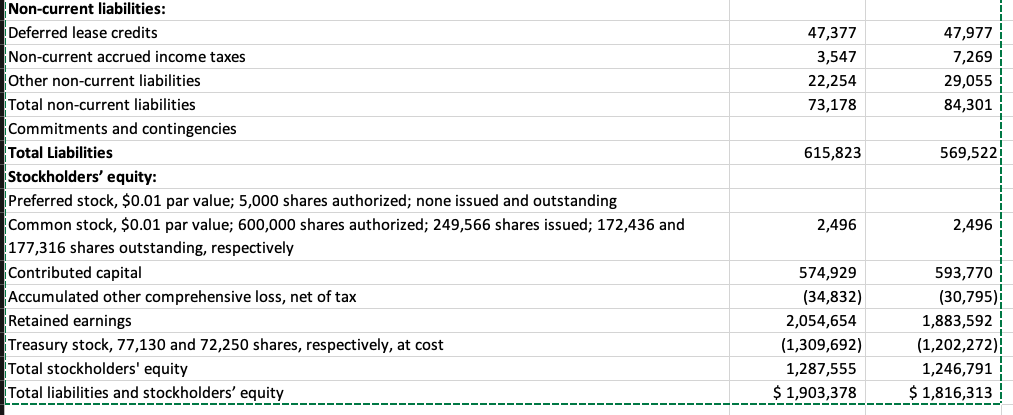
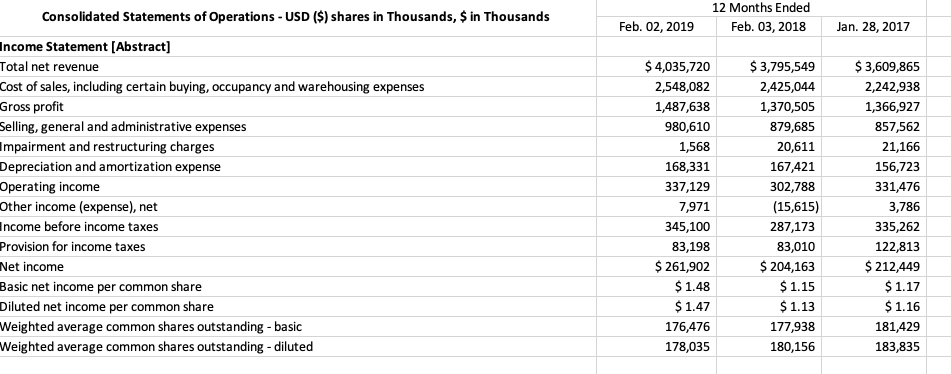
I need to calculate inventory turnover ratio, gross profit ratio, receivables turnover, and basic earnings per share (from income statement) I need to calculate inventory
I need to calculate inventory turnover ratio, gross profit ratio, receivables turnover, and basic earnings per share (from income statement)


I need to calculate inventory turnover ratio, gross profit ratio, receivables turnover, and basic earnings per share (from income statement)
I need to calculate inventory turnover ratio, gross profit ratio, receivables turnover, and basic earnings per share (from income statement)

I need to calculate inventory turnover ratio, gross profit ratio, receivables turnover, and basic earnings per share (from income statement)
Feb. 02, 2019 Feb. 03, 2018 $ 413,613 0 Consolidated Balance Sheets - USD ($) Current assets: Cash and cash equivalents Short-term investments (available for sale) Merchandise inventory Accounts receivable, net Prepaid expenses and other Total current assets Property and equipment, net of accumulated depreciation Intangible assets, net of accumulated amortization Goodwill Deferred income taxes Other assets Total assets Current liabilities: Accounts payable Accrued compensation and payroll taxes Accrued rent Accrued income and other taxes Unredeemed gift cards and gift certificates Current portion of deferred lease credits Other liabilities and accrued expenses Total current liabilities $ 333,330 92,135 424,404 93,477 102,907 1,046,253 742,149 43,268 14,899 14,062 42,747 1,903,378 398,213 78,304 78,400 968,530 724,239 46,666 15,070 9,344 52,464 1,816,313 240,671 82,173 89,076 20,064 53,997 9,974 46,690 542,645 236,703 54,324 83,312 12,781 52,347 11,203 34,551 485,221 47,377 3,547 22,254 73,178 47,977 7,269 29,055 84,301 615,823 569,5221 Non-current liabilities: Deferred lease credits Non-current accrued income taxes Other non-current liabilities Total non-current liabilities Commitments and contingencies Total Liabilities Stockholders' equity: Preferred stock, $0.01 par value; 5,000 shares authorized; none issued and outstanding Common stock, $0.01 par value; 600,000 shares authorized; 249,566 shares issued; 172,436 and 177,316 shares outstanding, respectively Contributed capital Accumulated other comprehensive loss, net of tax Retained earnings Treasury stock, 77,130 and 72,250 shares, respectively, at cost Total stockholders' equity Total liabilities and stockholders' equity 2,496 2,496 574,929 (34,832) 2,054,654 (1,309,692) 1,287,555 $ 1,903,378 593,770 (30,795) 1,883,592 (1,202,272) 1,246,791 $ 1,816,313 12 Months Ended Feb. 03, 2018 Feb. 02, 2019 Jan. 28, 2017 Consolidated Statements of Operations - USD ($) shares in Thousands, $ in Thousands Income Statement [Abstract] Total net revenue Cost of sales, including certain buying, occupancy and warehousing expenses Gross profit Selling, general and administrative expenses Impairment and restructuring charges Depreciation and amortization expense Operating income Other income (expense), net Income before income taxes Provision for income taxes Net income Basic net income per common share Diluted net income per common share Weighted average common shares outstanding - basic Weighted average common shares outstanding - diluted $ 4,035,720 2,548,082 1,487,638 980,610 1,568 168,331 337,129 7,971 345,100 83,198 $ 261,902 $ 1.48 $ 1.47 176,476 178,035 $ 3,795,549 2,425,044 1,370,505 879,685 20,611 167,421 302,788 (15,615) 287,173 83,010 $ 204,163 $ 1.15 $ 1.13 177,938 180,156 $ 3,609,865 2,242,938 1,366,927 857,562 21,166 156,723 331,476 3,786 335,262 122,813 $ 212,449 $ 1.17 $ 1.16 181,429 183,835Step by Step Solution
There are 3 Steps involved in it
Step: 1

Get Instant Access to Expert-Tailored Solutions
See step-by-step solutions with expert insights and AI powered tools for academic success
Step: 2

Step: 3

Ace Your Homework with AI
Get the answers you need in no time with our AI-driven, step-by-step assistance
Get Started


