

Question
I need to calculate the cash coverage ratio (Cash Flows from Operating Activities (before interest and taxes) / Interest Paid). If you could solve and
I need to calculate the cash coverage ratio (Cash Flows from Operating Activities (before interest and taxes) / Interest Paid). If you could solve and show me how you found the numbers to plug into the formula for the ratio, I would greatly appreciate it.
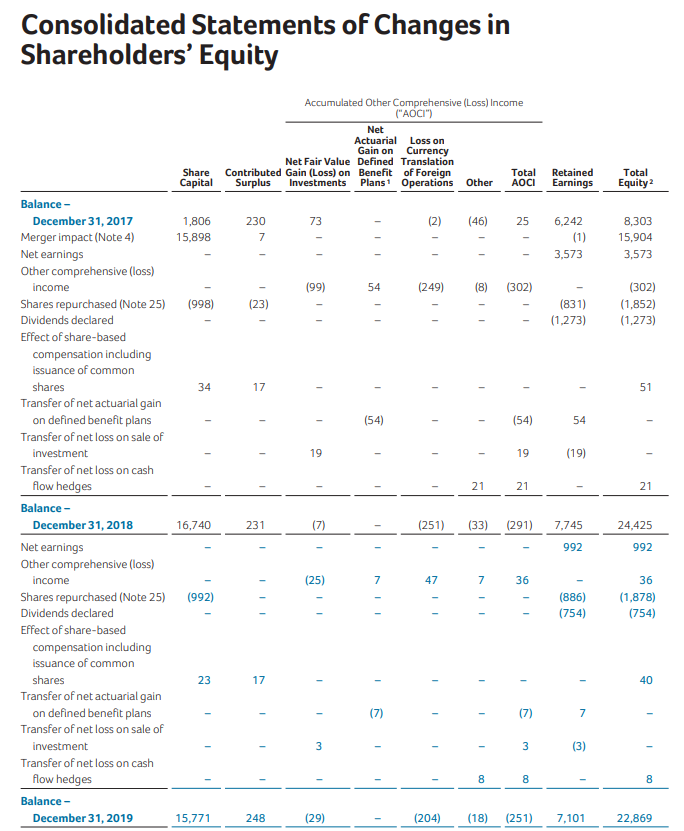
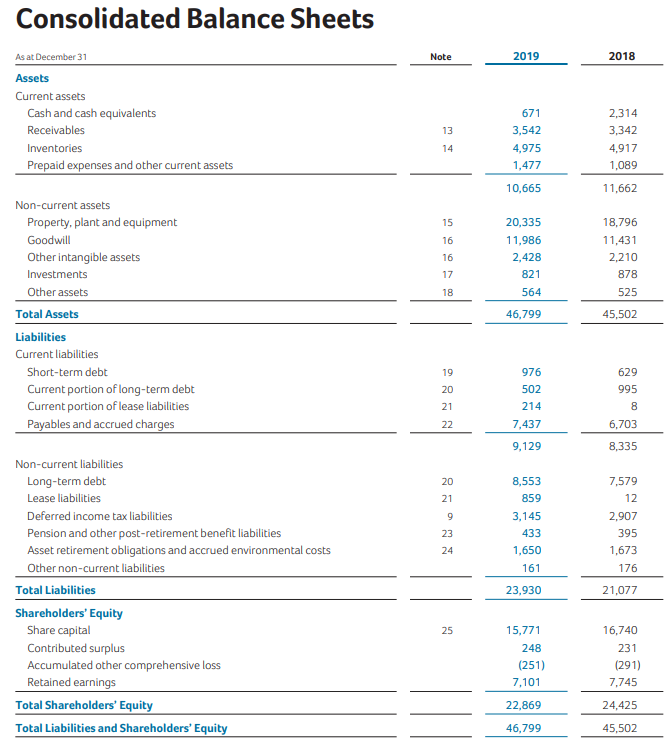
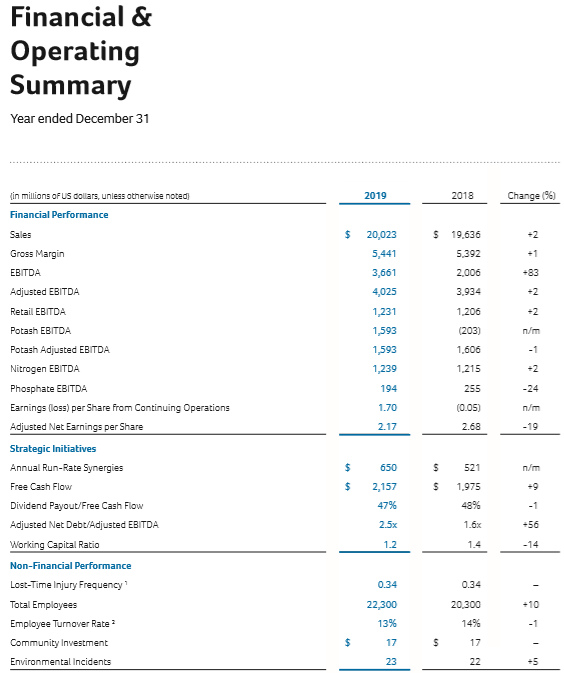
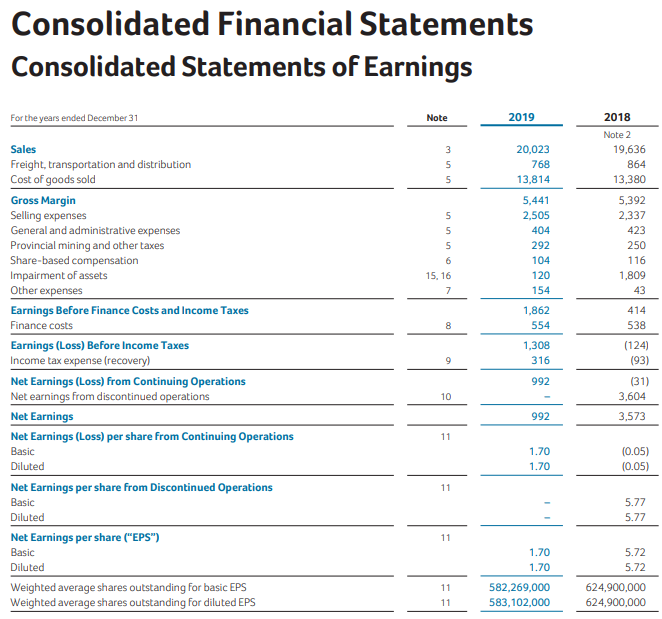
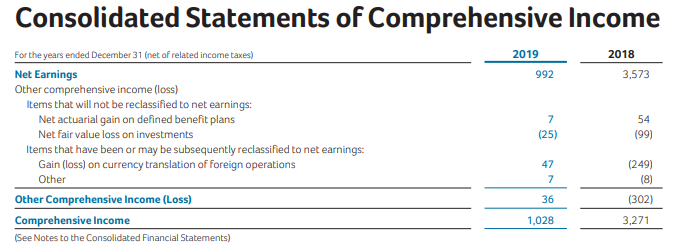
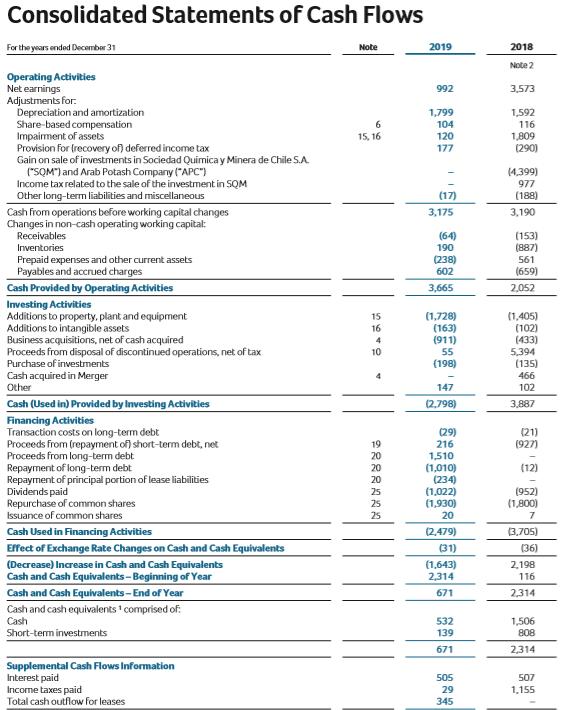
Consolidated Statements of Changes in Shareholders' Equity Accumulated Other Comprehensive (Loss) Income ("AOCI") Net Actuarial Loss on Gain on Currency Net Fair Value Defined Translation Contributed Gain (Loss) on Benefit of Foreign Total Surplus Investments Plans: Operations Other AOCI Share Capital Retained Earnings Total Equity 2 73 (2) (46) 25 1,806 15,898 230 7 6,242 (1) 3,573 8,303 15,904 3,573 (99) 54 (249) 8) (302) (998) (23) (831) (1,273) (302) (1,852) (1,273) 34 17 - - - - - - 51 - 54 - (54) 54 19 - 1 19 (19) - - - 21 21 21 Balance - December 31, 2017 Merger impact (Note 4) Net earnings Other comprehensive (loss) income Shares repurchased (Note 25) Dividends declared Effect of share-based compensation including issuance of common shares Transfer of net actuarial gain on defined benefit plans Transfer of net loss on sale of investment Transfer of net loss on cash flow hedges Balance - December 31, 2018 Net earnings Other comprehensive (loss) income Shares repurchased (Note 25) Dividends declared Effect of share-based compensation including issuance of common shares Transfer of net actuarial gain on defined benefit plans Transfer of net loss on sale of investment Transfer of net loss on cash flow hedges Balance - December 31, 2019 16,740 231 (7) (251) (33) (291) 7.745 24,425 - - - 992 992 (25) 7 47 7 36 (992) (886) (754) 36 (1,878) (754) 23 17 - - - - 40 - (7) - - (7) 7 3 - 3 (3) - 00 8 8 15,771 248 (29) (204) (18) (251) 7,101 22,869 Consolidated Balance Sheets Note 2019 2018 As at December 31 Assets Current assets Cash and cash equivalents Receivables Inventories Prepaid expenses and other current assets 13 671 3,542 4,975 1,477 2,314 3,342 4,917 1,089 14 10,665 11,662 15 16 16 17 20,335 11,986 2,428 821 564 18,796 11,431 2,210 878 525 18 Non-current assets Property, plant and equipment Goodwill Other intangible assets Investments Other assets Total Assets Liabilities Current liabilities Short-term debt Current portion of long-term debt Current portion of lease liabilities Payables and accrued charges 46,799 45,502 19 20 21 976 502 214 7,437 629 995 8 22 6,703 9,129 8,335 20 21 9 23 24 8,553 859 3,145 433 1,650 161 7,579 12 2,907 395 1,673 176 Non-current liabilities Long-term debt Lease liabilities Deferred income tax liabilities Pension and other post-retirement benefit liabilities Asset retirement obligations and accrued environmental costs Other non-current liabilities Total Liabilities Shareholders' Equity Share capital Contributed surplus Accumulated other comprehensive loss Retained earnings Total Shareholders' Equity Total Liabilities and Shareholders' Equity 23,930 21,077 25 15,771 248 (251) 7,101 16,740 231 (291) 7,745 22,869 24,425 46,799 45,502 Financial & Operating Summary Year ended December 31 in millions of US dollars, unless otherwise noted 2019 2018 Change (96) Financial Performance $ $ 19,636 Sales Gross Margin EBITDA 20,023 5,441 3,661 5.392 -83 2.006 3,934 Adjusted EBITDA 4,025 -2 Retail EBITDA 1,231 1.206 1593 (203) 1,606 Potash EBITDA Potash Adjusted EBITDA Nitrogen EBITDA Phosphate EBITDA 1,593 1,239 1.215 194 255 -24 1.70 (0.05) n/m 2.17 2.68 -19 $ 650 $ 521 Earnings (loss) per Share from Continuing Operations Adjusted Net Earnings per Share Strategic Initiatives Annual Run-Rate Synergies Free Cash Flow Dividend Payout/Free Cash Flow Adjusted Net Debt/Adjusted EBITDA Working Capital Ratio $ S 1.975 -9 2,157 47% 48% -1 25x 1.6% -56 1.2 1.4 -14 0.34 0.34 Non-Financial Performance Lost-Time Injury Frequency Total Employees Employee Turnover Rate? Community Investment 20.300 -10 22,300 13% 14% -1 $ 17 $ 17 Environmental Incidents 23 22 -5 Consolidated Financial Statements Consolidated Statements of Earnings For the years ended December 31 Note 2019 20.023 768 13,814 2018 Note 2 19,636 864 13.380 5 5 5 6 15. 16 7 5,441 2,505 404 292 104 120 154 1,862 554 5,392 2,337 423 250 116 1,809 43 414 538 8 (124) 1,308 316 9 (93) Sales Freight, transportation and distribution Cost of goods sold Gross Margin Selling expenses General and administrative expenses Provincial mining and other taxes Share-based compensation Impairment of assets Other expenses Earnings Before Finance Costs and Income Taxes Finance costs Earnings (Loss) Before Income Taxes Income tax expense (recovery) Net Earnings (Loss) from Continuing Operations Net earnings from discontinued operations Net Earnings Net Earnings (Loss) per share from Continuing Operations Basic Diluted Net Earnings per share from Discontinued Operations Basic Diluted Net Earnings per share ("EPS") Basic Diluted Weighted average shares outstanding for basic EPS Weighted average shares outstanding for diluted EPS 992 (31) 3,604 10 992 3,573 11 1.70 1.70 (0.05) (0.05) 11 5.77 5.77 11 1.70 1.70 5.72 5.72 11 582,269,000 583,102,000 624,900,000 624,900,000 11 Consolidated Statements of Comprehensive Income 2018 2019 992 3,573 7 (25) 54 (99) For the years ended December 31 (net of related income taxes) Net Earnings Other comprehensive income (loss) Items that will not be reclassified to net earnings: Net actuarial gain on defined benefit plans Net fair value loss on investments Items that have been or may be subsequently reclassified to net earnings: Gain (loss) on currency translation of foreign operations Other Other Comprehensive Income (Loss) Comprehensive Income (See Notes to the Consolidated Financial Statements) 47 7 (249) (8) (302) 3,271 36 1,028 Consolidated Statements of Cash Flows For the years ended December 31 Note 2019 2018 Note 2 992 3.573 1.799 104 120 1,592 116 1,809 (290) 15, 16 177 (17) 3,175 14.399) 977 (188) 3,190 (64) 190 (238) 602 3,665 (153) (887) 561 (659) 2,052 Operating Activities Net earnings Adjustments for: Depreciation and amortization Share-based compensation Impairment of assets Provision for (recovery of) deferred income tax Gain on sale of investments in Sociedad Quimica y Minera de Chile S.A ("SOM") and Arab Potash Company ("APC") Income tax related to the sale of the investment in SOM Other long-term liabilities and miscellaneous Cash from operations before working capital changes Changes in non-cash operating working capital: Receivables Inventories Prepaid expenses and other current assets Payables and accrued charges Cash Provided by Operating Activities Investing Activities Additions to property, plant and equipment Additions to intangible assets Business acquisitions, net of cash acquired Proceeds from disposal of discontinued operations, net of tax Purchase of investments Cash acquired in Merger Other Cash (Used in) Provided by Investing Activities Financing Activities Transaction costs on long-term debt Proceeds from (repayment of short-term debt, net Proceeds from long-term debt Repayment of long-term debt Repayment of principal portion of lease liabilities Dividends paid Repurchase of common shares Issuance of common shares Cash Used in Financing Activities Effect of Exchange Rate Changes on Cash and Cash Equivalents (Decrease) Increase in Cash and Cash Equivalents Cash and Cash Equivalents-Beginning of Year Cash and Cash Equivalents - End of Year Cash and cash equivalents comprised of: Cash Short-term investments 15 16 4 10 (1,728) (163) (911) 55 (198) (1.405) (102) (433) 5,394 (135) 466 102 3.887 4 147 (2.798) (21) 1927) (12) 20 25 25 25 (29) 216 1,510 (1,010) (234) (1.022) (1,930) 20 12.479) (31) (1,643) 2,314 (952) (1.800) 7 (3.705) (36) 2.198 116 2,314 671 532 139 1,506 808 671 2,314 Supplemental Cash Flows Information Interest paid Income taxes paid Total cash outflow for leases 505 29 345 507 1.155
Step by Step Solution
There are 3 Steps involved in it
Step: 1

Get Instant Access to Expert-Tailored Solutions
See step-by-step solutions with expert insights and AI powered tools for academic success
Step: 2

Step: 3
Ace Your Homework with AI
Get the answers you need in no time with our AI-driven, step-by-step assistance
Get Started
Standard For Auditing Computer Applications
Authors: Martin A. Krist
2nd Edition
0849399831, 978-0849399831