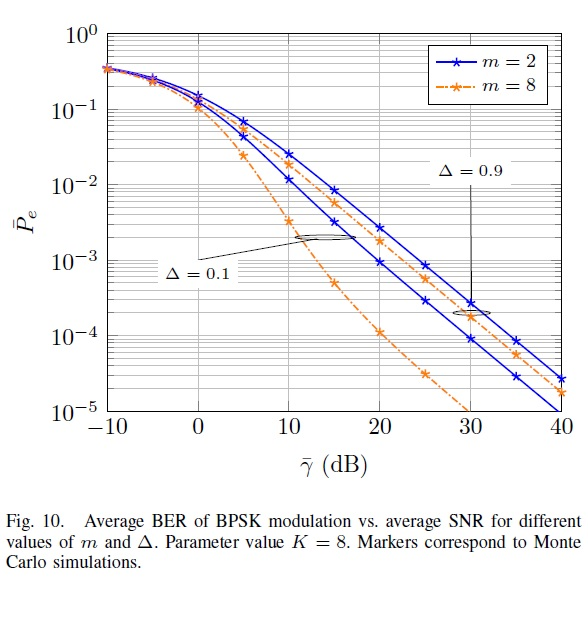
I need to correct my code in order to reproduce this graph of this figure. -What I need: introduce those blue lines that representing FTR
I need to correct my code in order to reproduce this graph of this figure.
-What I need:
introduce those blue lines that representing FTR fading model who has this two parameters:


and

Please correct my code. Thank you.
--------------------------------------------------------------------------------------------------------
Matlab code:
clc; clear all; close all; M=2; K=5; divorder=1; EbNo = -10:5:40; BER_Ray=berfading(EbNo,'psk',M,divorder) BER_Rician = berfading(EbNo,'psk',2,1,K); BER = berawgn(EbNo,'psk',M,'nondiff'); semilogy (EbNo,BER,'o-'); hold on semilogy (EbNo,BER_Ray,'*-'); semilogy (EbNo,BER_Rician,'+-'); grid on % % plot legend('AWGN CHANNEL','Rayleigh Channel','Rician Channel');%, 'Rayleigh Simulation'); xlabel('Eb/No,dB'); ylabel('Bit Error Rate'); axis([-10 40 1e-5 .5])

Step by Step Solution
There are 3 Steps involved in it
Step: 1

See step-by-step solutions with expert insights and AI powered tools for academic success
Step: 2

Step: 3

Ace Your Homework with AI
Get the answers you need in no time with our AI-driven, step-by-step assistance
Get Started


