Answered step by step
Verified Expert Solution
Link Copied!

Question

1 Approved Answer

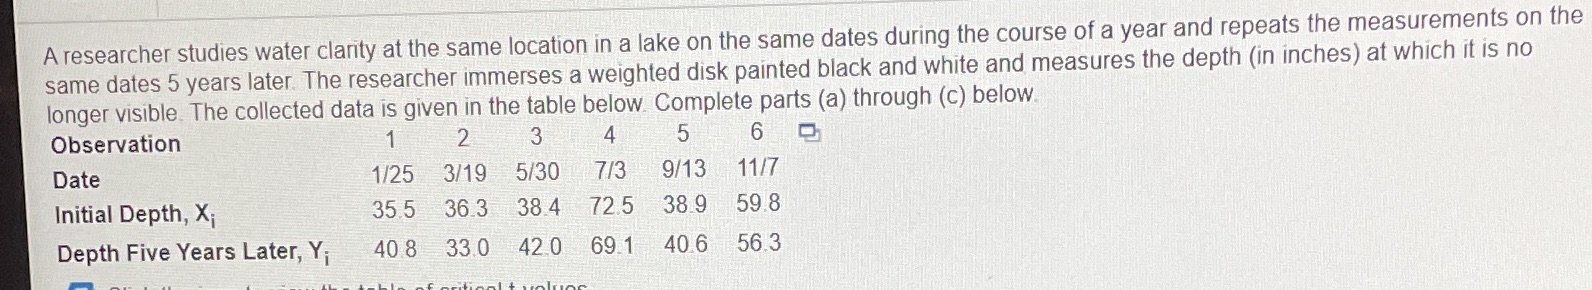
I need to find the t-statistic and p value and what the box plot will look like please! A researcher studies water clarity at the

I need to find the t-statistic and p value and what the box plot will look like please!

image text in transcribed
A researcher studies water clarity at the same location in a lake on the same dates during the course of a year and repeats the measurements on the same dates 5 years later. The researcher immerses a weighted disk painted black and white and measures the depth (in inches) at which it is no longer visible. The collected data is given in the table below. Complete parts (a) through (c) below. Observation 1 2 3 4 5 6 Date 1/25 3/19 5/30 713 9/13 11/7 Initial Depth, X; 35 5 36.3 38.4 72.5 389 59.8 Depth Five Years Later, Yi 40 8 330 420 69 1 40.6 56.3

Step by Step Solution

There are 3 Steps involved in it

Step: 1

blur-text-image

Get Instant Access to Expert-Tailored Solutions

See step-by-step solutions with expert insights and AI powered tools for academic success

Step: 2

blur-text-image

Step: 3

blur-text-image

Ace Your Homework with AI

Get the answers you need in no time with our AI-driven, step-by-step assistance

Get Started

Recommended Textbook for

Algebra And Trigonometry

Authors: Cynthia Y Young

5th Edition

1119820898, 9781119820895

More Books

Students also viewed these Mathematics questions