

Question: I need to know how to create a bar chart using R which shows number of countries for every income groups R Go to file/function
I need to know how to create a bar chart using R which shows number of countries for every income groups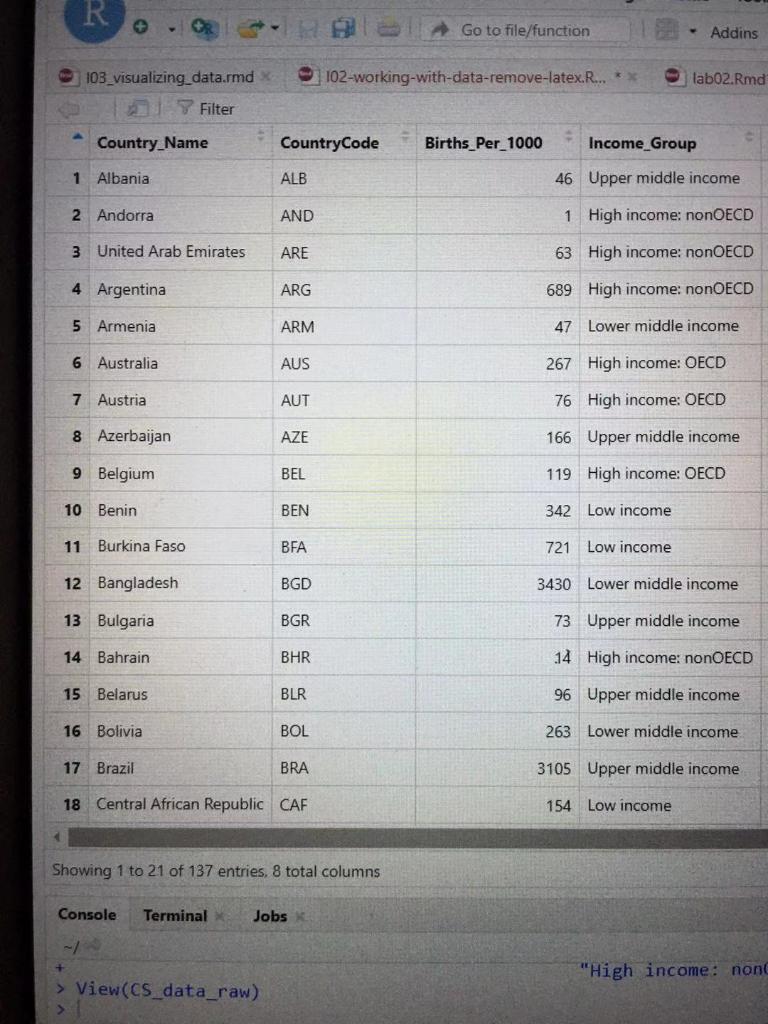
R Go to file/function Addins 102-working-with-data-remove-latex.R... ** lab02.Rmd 103_visualizing data.rmd 7 Filter Country Name CountryCode Births_per_1000 Income_Group 1 Albania ALB 46 Upper middle income 2 Andorra AND 1 High income: nonOECD 3 United Arab Emirates ARE 63 High income: non OECD 4 Argentina ARG 689 High income: nonOECD 5 Armenia ARM 47 Lower middle income 6 Australia AUS 267 High income: OECD 7 Austria AUT 76 High income: OECD 8 Azerbaijan AZE 166 Upper middle income 9 Belgium BEL 119 High income: OECD 10 Benin BEN 342 Low income 11 Burkina Faso BFA 721 Low income 12 Bangladesh BGD 3430 Lower middle income 13 Bulgaria BGR 73 Upper middle income 14 Bahrain BHR 14 High income: nonOECD 15 Belarus BLR 96 Upper middle income 16 Bolivia BOL 263 Lower middle income 17 Brazil BRA 3105 Upper middle income 18 Central African Republic CAF 154 Low income Showing 1 to 21 of 137 entries. 8 total columns Console Terminal Jobs "High income: non > View(CS_data_raw)
Step by Step Solution
There are 3 Steps involved in it
To create a bar chart in R showing the number of countries for each income group you ca... View full answer

Get step-by-step solutions from verified subject matter experts