Answered step by step
Verified Expert Solution
Question
1 Approved Answer
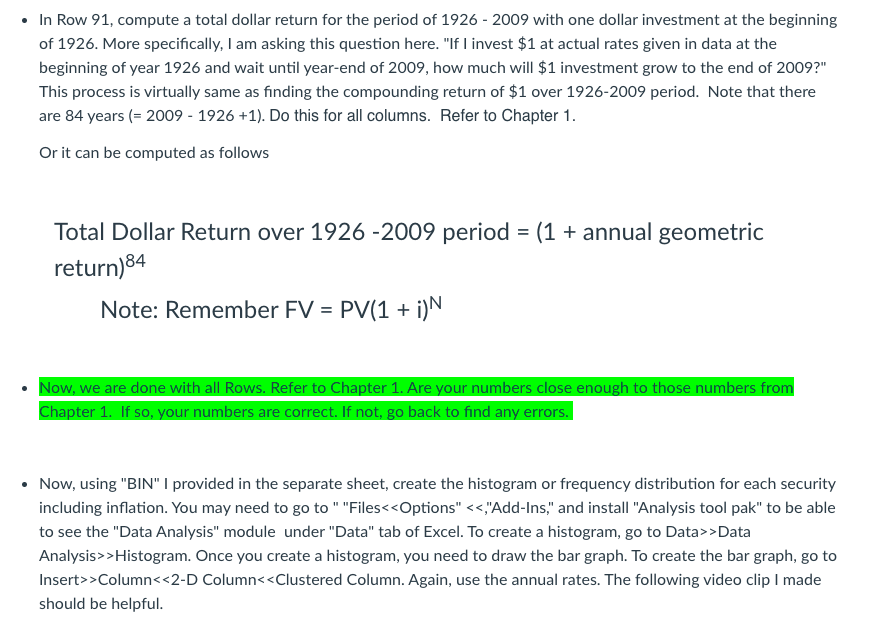
I need to know what the formula for this would look like in excel. Thank you! In Row 91, compute a total dollar return for

I need to know what the formula for this would look like in excel. Thank you!
In Row 91, compute a total dollar return for the period of 1926 - 2009 with one dollar investment at the beginning of 1926. More specifically, I am asking this question here. "If I invest $1 at actual rates given in data at the beginning of year 1926 and wait until year-end of 2009, how much will $1 investment grow to the end of 2009?" This process is virtually same as finding the compounding return of $1 over 1926-2009 period. Note that there are 84 years (= 2009 - 1926 +1). Do this for all columns. Refer to Chapter 1. Or it can be computed as follows Total Dollar Return over 1926-2009 period = (1 + annual geometric return)84 Note: Remember FV = PV(1 + i)N Now, we are done with all Rows. Refer to Chapter 1. Are your numbers close enough to those numbers from Chapter 1. If so, your numbers are correct. If not, go back to find any errors. Now, using "BIN" I provided in the separate sheet, create the histogram or frequency distribution for each security including inflation. You may need to go to " "Files>Data Analysis>>Histogram. Once you create a histogram, you need to draw the bar graph. To create the bar graph, go to Insert>>Column>Data Analysis>>Histogram. Once you create a histogram, you need to draw the bar graph. To create the bar graph, go to Insert>>Column
Step by Step Solution
There are 3 Steps involved in it
Step: 1

Get Instant Access to Expert-Tailored Solutions
See step-by-step solutions with expert insights and AI powered tools for academic success
Step: 2

Step: 3

Ace Your Homework with AI
Get the answers you need in no time with our AI-driven, step-by-step assistance
Get Started


