

Question
I need to plot V a =q*V m * cos(w o t+ ) in matlab with a 20% step change in voltage gain at t=0.1s
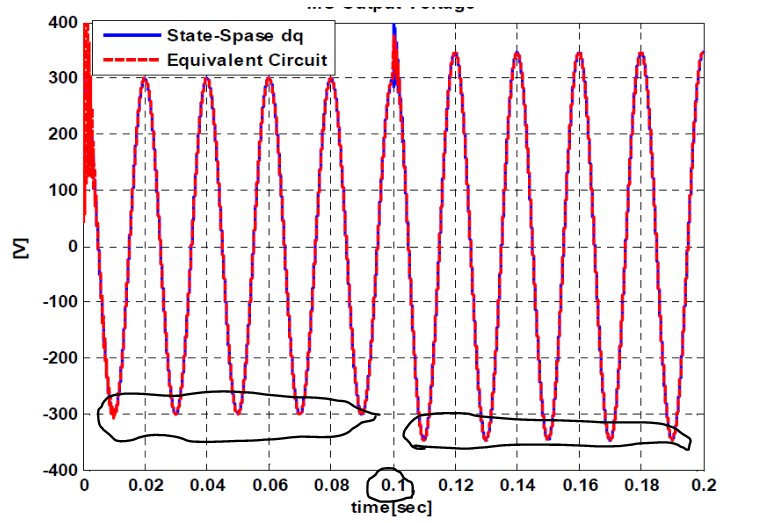
I need to plot Va=q*Vm* cos(wot+ ) in matlab with a 20% step change in voltage gain at t=0.1s like below
where
q (voltage gain)=0.5 ;Vm=720v; fo=50 Hz; =0
=0
what is the change in this code to the voltage will continue to rise (with a 20% step change in voltage gain) after t=0.1s
Code:
clc; clear all; close all;
fs = 1000; t = 0:1/fs:0.2;
Vm = 720; % Volt f0 = 50 ;% Hz q = 0.5 ; % Voltage Gain alpha = 0;
Va = Vm*q*cos(2*pi*f0*t + alpha);
Vb = Vm*(q + 0.2*q*(t == 0.1)).*cos(2*pi*f0*t + alpha);
figure, plot(t,Va,'r',t,Vb,'b'); xlabel('Time'); ylabel('Va and Vb')
Step by Step Solution
There are 3 Steps involved in it
Step: 1

Get Instant Access to Expert-Tailored Solutions
See step-by-step solutions with expert insights and AI powered tools for academic success
Step: 2

Step: 3
Ace Your Homework with AI
Get the answers you need in no time with our AI-driven, step-by-step assistance
Get Started
Intranet And Web Databases For Dummies
Authors: Paul Litwin
1st Edition
0764502212, 9780764502217