

Answered step by step
Verified Expert Solution
Question
1 Approved Answer
I need to solve B A portfolio manager summarizes the input from the macro and micro forecasters in the following table Micro Forecasts Residual Standard
I need to solve B
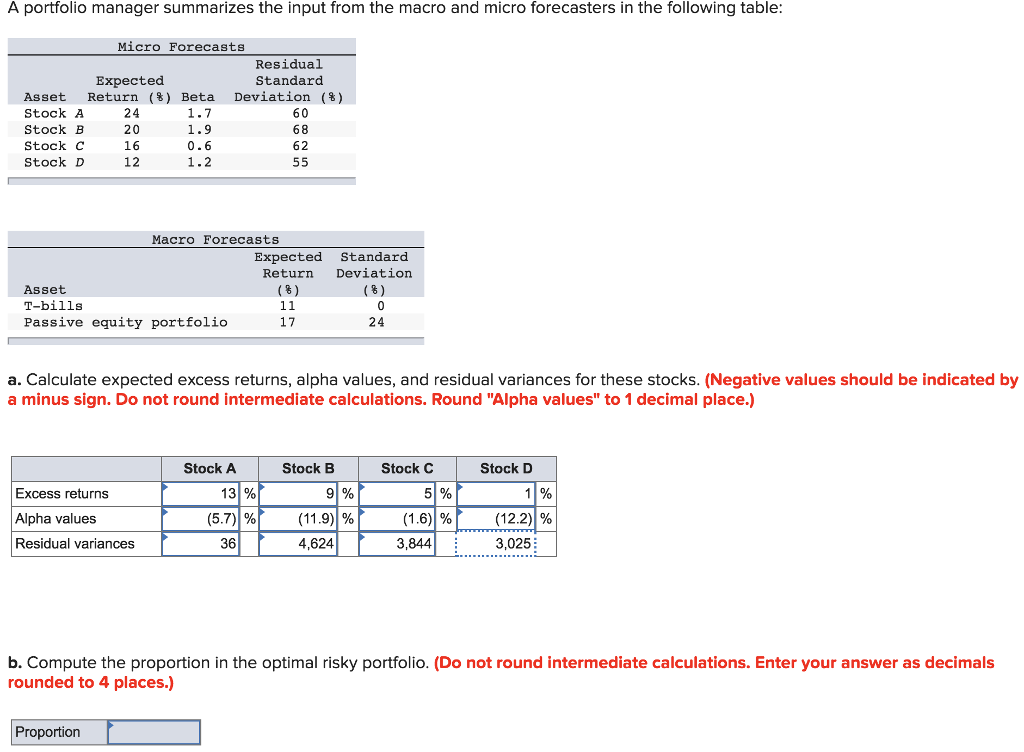
A portfolio manager summarizes the input from the macro and micro forecasters in the following table Micro Forecasts Residual Standard Expected Asset Return (%) Beta Deviation (%) Stock A Stock B Stock C Stock D 24 20 16 12 60 68 62 1.9 1.2 Macro Forecasts Expected Standard Return Deviation Asset T-bills Passive equity portfolio 17 24 a. Calculate expected excess returns, alpha values, and residual variances for these stocks. (Negative values should be indicated by a minus sign. Do not round intermediate calculations. Round "Alpha values" to 1 decimal place.) Stock A Stock B Stock C Stock D 131% 91% (11.9)| % 4,624 11% Excess returns Alpha values Residual variances (57)| % (12.2) % 3,025 36 3,844 b. Compute the proportion in the optimal risky portfolio. (Do not round intermediate calculations. Enter your answer as decimals rounded to 4 places.) ProportionStep by Step Solution
There are 3 Steps involved in it
Step: 1

Get Instant Access to Expert-Tailored Solutions
See step-by-step solutions with expert insights and AI powered tools for academic success
Step: 2

Step: 3
Ace Your Homework with AI
Get the answers you need in no time with our AI-driven, step-by-step assistance
Get Started
Handbook Of High Frequency Trading
Authors: Greg N. Gregoriou
1st Edition
0128022051, 978-0128022054