Answered step by step
Verified Expert Solution
Link Copied!

Question

1 Approved Answer

I neef help completing questions 3-5. Thank you. University Signature Assignment - Page 2 of 2 3. (CLO 2) Test a claim that the mean

I neef help completing questions 3-5. Thank you.
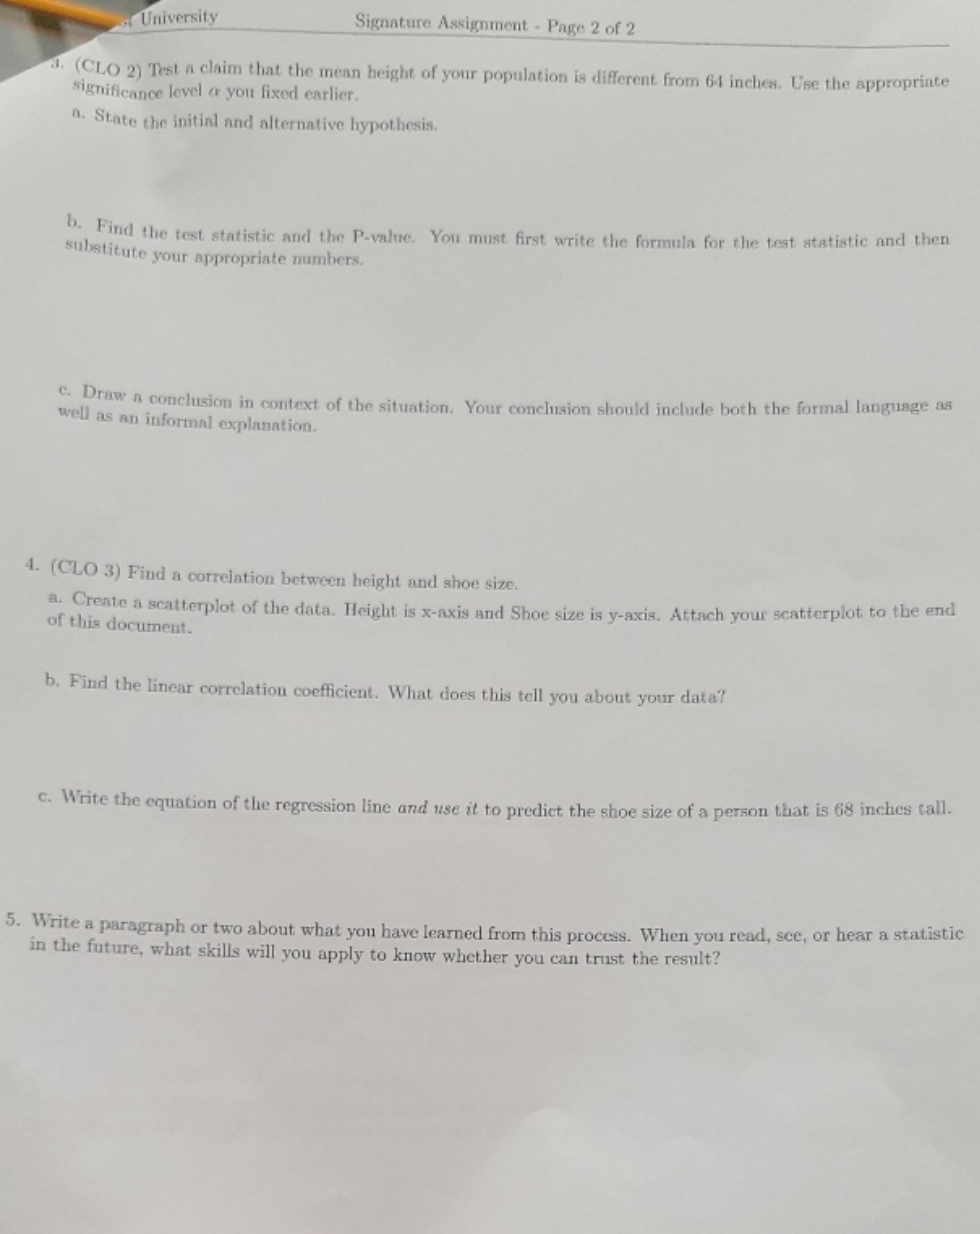
image text in transcribed
University Signature Assignment - Page 2 of 2 3. (CLO 2) Test a claim that the mean height of your population is different from 64 inches. Use the appropriate significance level or you fixed earlier. 0. State the initial and alternative hypothesis. b. Find the test statistic and the P-value. You must first write the formula for the test statistic and then substitute your appropriate numbers. c. Draw a conclusion in context of the situation. Your conclusion should include both the formal language as well as an informal explanation. 4. (CLO 3) Find a correlation between height and shoe size. a. Create a scatterplot of the data. Height is x-axis and Shoe size is y-axis. Attach your scatterplot to the end of this document. b. Find the linear correlation coefficient. What does this tell you about your data? c. Write the equation of the regression line and use it to predict the shoe size of a person that is 68 inches tall. 5. Write a paragraph or two about what you have learned from this process. When you read, see, or hear a statistic in the future, what skills will you apply to know whether you can trust the result

Step by Step Solution

There are 3 Steps involved in it

Step: 1

blur-text-image

Get Instant Access to Expert-Tailored Solutions

See step-by-step solutions with expert insights and AI powered tools for academic success

Step: 2

blur-text-image

Step: 3

blur-text-image

Ace Your Homework with AI

Get the answers you need in no time with our AI-driven, step-by-step assistance

Get Started

Recommended Textbook for

Practical Linear Algebra A Geometry Toolbox

Authors: Gerald Farin, Dianne Hansford

4th Edition

1003051219, 9781003051213

More Books

Students also viewed these Mathematics questions