I
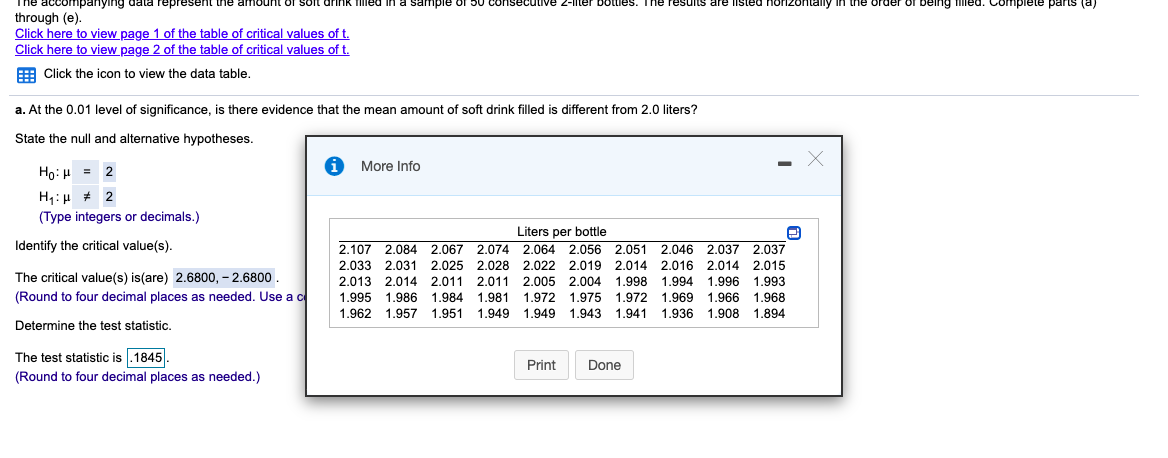
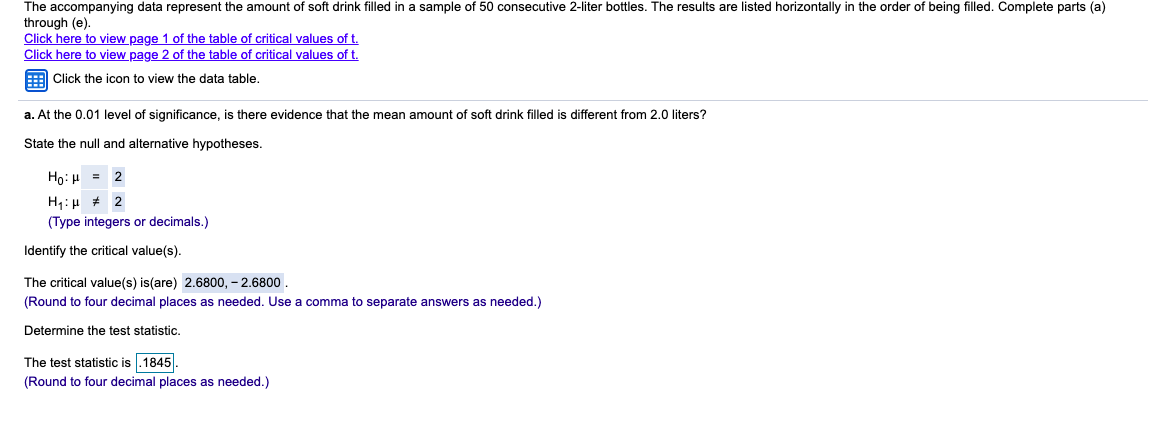
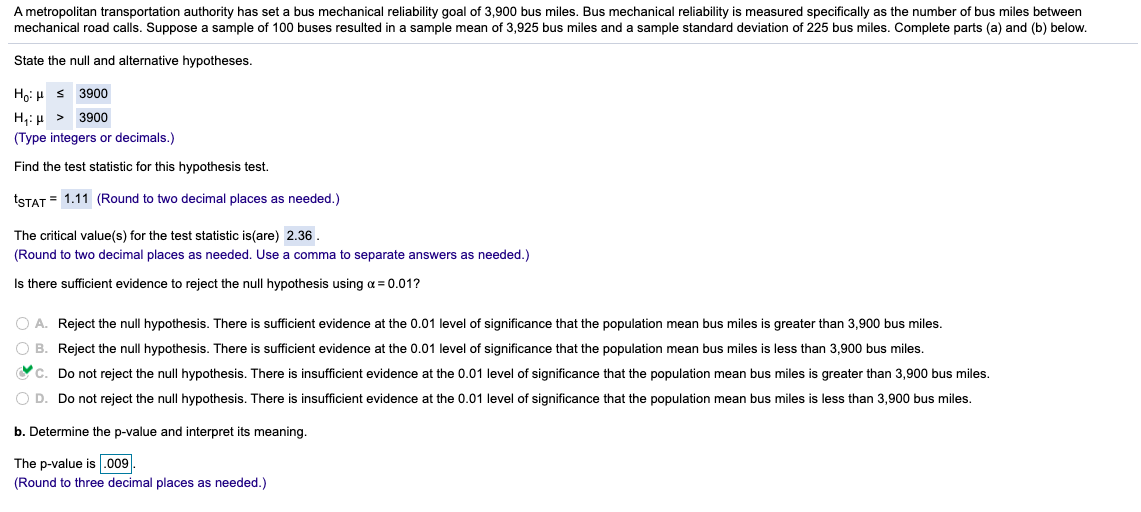
npanying through (e). Click here to view page 1 of the table of critical values of t. Click here to view page 2 of the table of critical values of t. Click the icon to view the data table. a. At the 0.01 level of significance, is there evidence that the mean amount of soft drink filled is different from 2.0 liters? State the null and alternative hypotheses. 2 i More Info - X Ho: H = (Type integers or decimals.) Liters per bottle Identify the critical value(s). 2.107 2.084 2.067 2.074 2.064 2.056 2.051 2.046 2.037 2.037 2.033 2.031 2.025 2.028 2.022 2.019 2.014 2.016 2.014 2.015 The critical value(s) is(are) 2.6800, - 2.6800 . 2.013 2.014 2.011 2.011 2.005 2.004 1.998 1.994 1.996 1.993 Round to four decimal places as needed. Use a c 1.995 1.986 1.984 1.981 1.972 1.975 1.972 1.969 1.966 1.968 1.962 1.957 1.951 1.949 1.949 1.943 1.941 1.936 1.908 1.894 Determine the test statistic. The test statistic is . 1845. Print Done (Round to four decimal places as needed.)The accompanying data represent the amount of soft drink filled in a sample of 50 consecutive 2-liter bottles. The results are listed horizontally in the order of being filled. Complete parts (a) through (e). Click here to view page 1 of the table of critical values of t. Click here to view page 2 of the table of critical values of t. Click the icon to view the data table. a. At the 0.01 level of significance, is there evidence that the mean amount of soft drink filled is different from 2.0 liters? State the null and alternative hypotheses. Ho: H = 2 H: H # 2 (Type integers or decimals.) Identify the critical value(s). The critical value(s) is(are) 2.6800, - 2.6800 . (Round to four decimal places as needed. Use a comma to separate answers as needed.) Determine the test statistic. The test statistic is .1845 (Round to four decimal places as needed.)A metropolitan transportation authority has set a bus mechanical reliability goal of 3,900 bus miles. Bus mechanical reliability is measured specifically as the number of bus miles between mechanical road calls. Suppose a sample of 100 buses resulted in a sample mean of 3,925 bus miles and a sample standard deviation of 225 bus miles. Complete parts (a) and (b) below. State the null and alternative hypotheses. Ho: H s 3900 H:p > 3900 (Type integers or decimals.) Find the test statistic for this hypothesis test. tSTAT = 1.11 (Round to two decimal places as needed.) The critical value(s) for the test statistic is(are) 2.36 . (Round to two decimal places as needed. Use a comma to separate answers as needed.) Is there sufficient evidence to reject the null hypothesis using a = 0.01? O A. Reject the null hypothesis. There is sufficient evidence at the 0.01 level of significance that the population mean bus miles is greater than 3,900 bus miles. O B. Reject the null hypothesis. There is sufficient evidence at the 0.01 level of significance that the population mean bus miles is less than 3,900 bus miles. C. Do not reject the null hypothesis. There is insufficient evidence at the 0.01 level of significance that the population mean bus miles is greater than 3,900 bus miles. O D. Do not reject the null hypothesis. There is insufficient evidence at the 0.01 level of significance that the population mean bus miles is less than 3,900 bus miles. b. Determine the p-value and interpret its meaning. The p-value is .009 (Round to three decimal places as needed.)