

Answered step by step
Verified Expert Solution
Question
1 Approved Answer
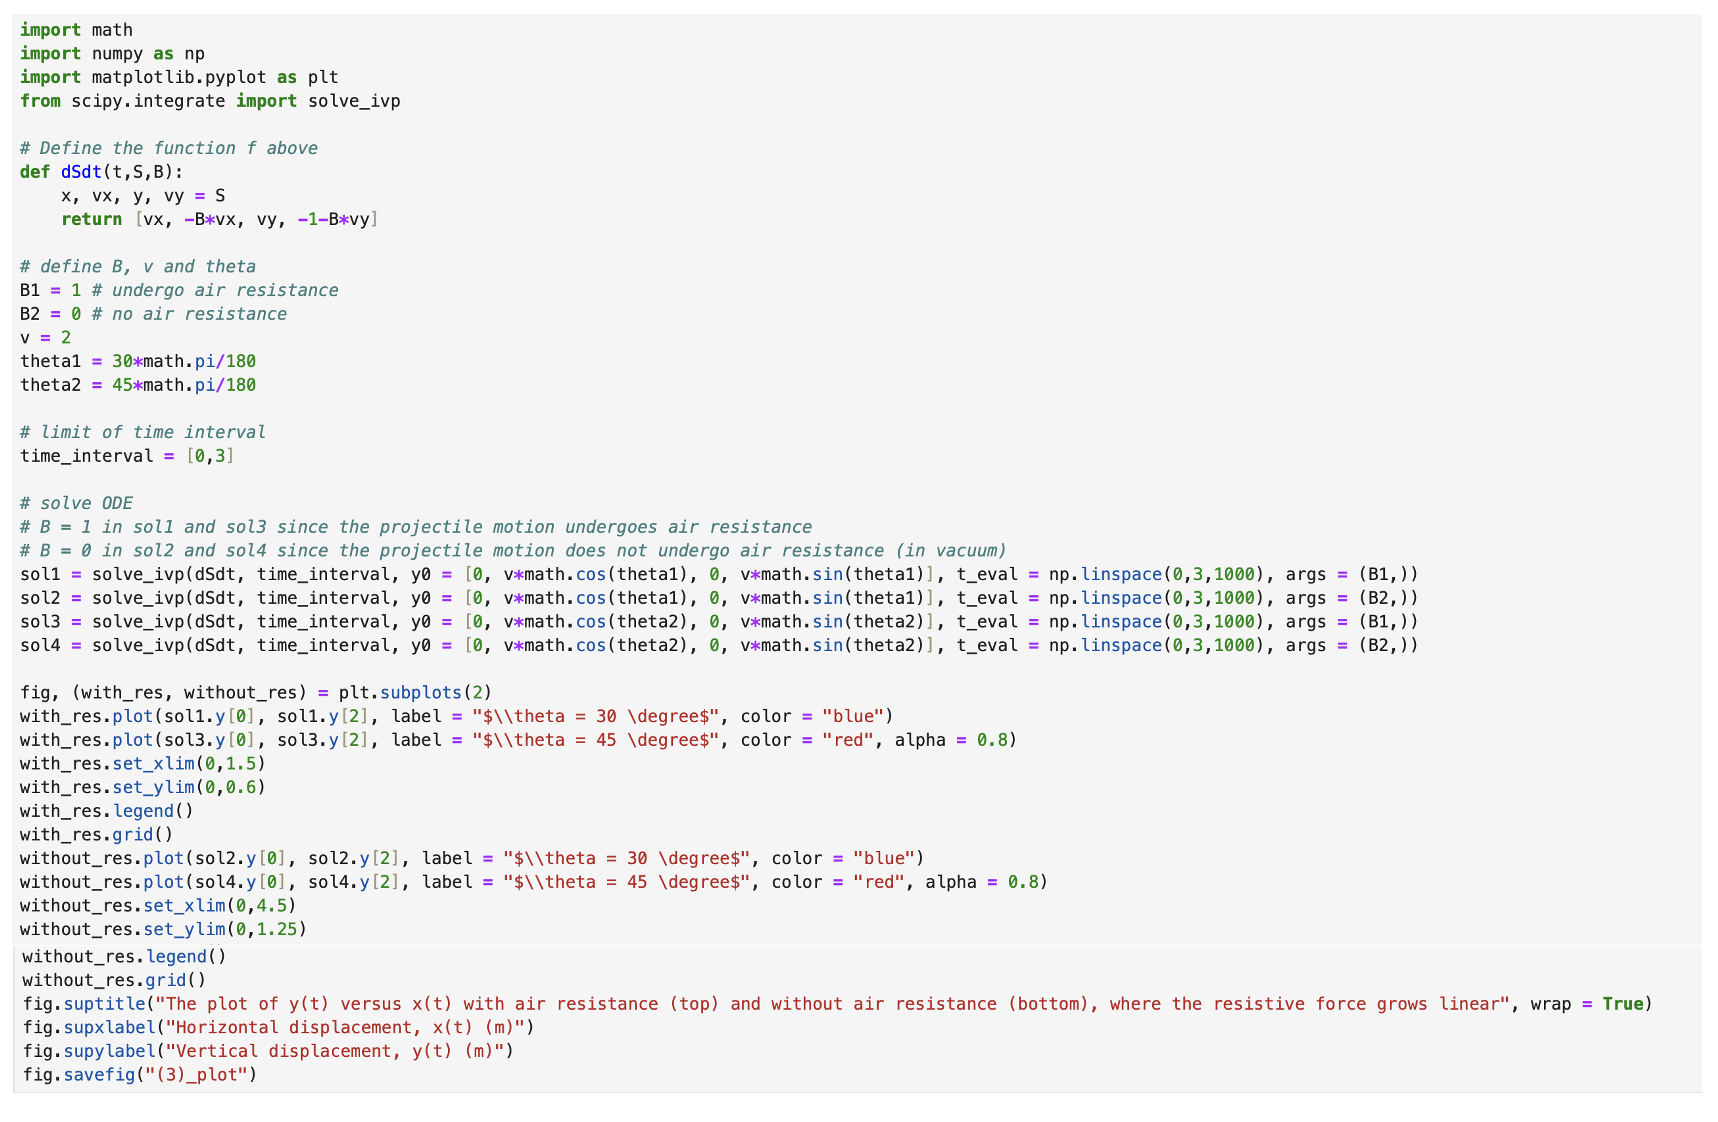
I only need help with part ( b ) . In part ( a ) , I already found and plot the graph of y
I only need help with part b In part a I already found and plot the graph of yt versus xt by using the following code
Consider now a spherical object launched with a velocity forming an angle with the horizontal ground. In the absence of air resistance, the trajectory followed by this projectile is known to be a parabola. This follows from writing Newton's law separately for the horizontal and vertical coordinates. The former scales linearly with time whereas the latter varies quadratically. Therefore, when time is eliminated, we are left with a quadratic equation that gives rise to a parabolic trajectory. Let's see how the trajectory changes when air resistance is no longer neglected. In the case of a resistive force that grows linearly with velocity we can still separate the motion between horizontal and vertical coordinates. Second Newton's law for both the horizontal and vertical coordinates become
The code written earlier can be applied to both directions separately, the difference being that gravity acts on the vertical direction axis but not on the horizontal one axis Once again, you will have results relating the coordinates and with the time
a Plot versus which will give you the trajectory followed by the object under the action
of air resistance. Superimpose this trajectory with the one which you would obtain in vacuum
to see how different the two cases are.
b Another wellknown fact, often derived in introductory physics courses, is that the launching angle of leads to the maximum horizontal displacement in a projectile motion. This is the case in the absence of air resistance. The question we now pose is whether this is also the case when air resistance is not neglected. You can now use your code to determine what the optimum launching angle is How does that depend on the mass Plot optimum as a function of
Step by Step Solution
There are 3 Steps involved in it
Step: 1

Get Instant Access to Expert-Tailored Solutions
See step-by-step solutions with expert insights and AI powered tools for academic success
Step: 2

Step: 3
Ace Your Homework with AI
Get the answers you need in no time with our AI-driven, step-by-step assistance
Get Started
Database Programming Languages 12th International Symposium Dbpl 2009 Lyon France August 2009 Proceedings Lncs 5708
Authors: Philippa Gardner ,Floris Geerts
2009th Edition
3642037925, 978-3642037924