I only need help with the last bullet point about the final recommendation.
I need help with the question at the end
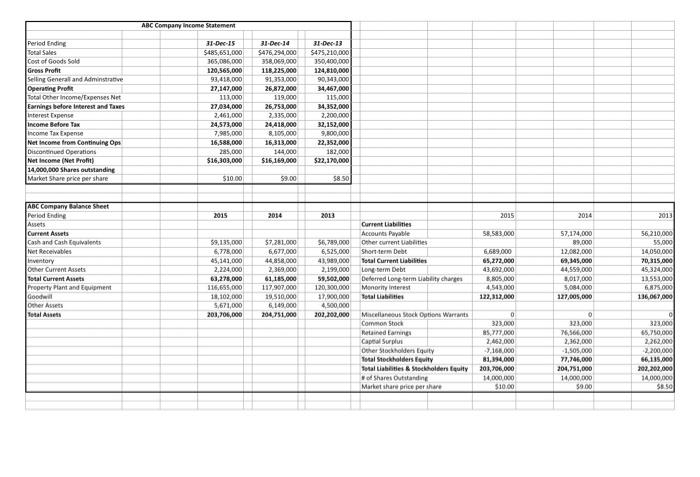
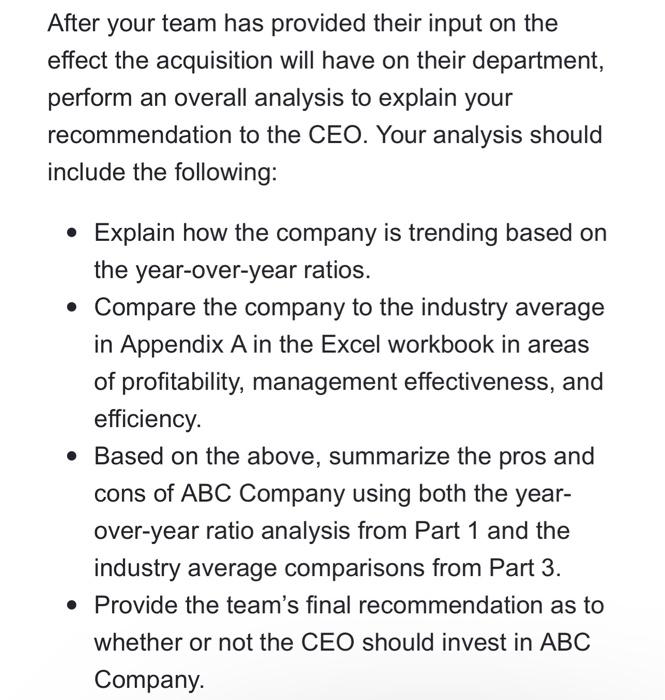
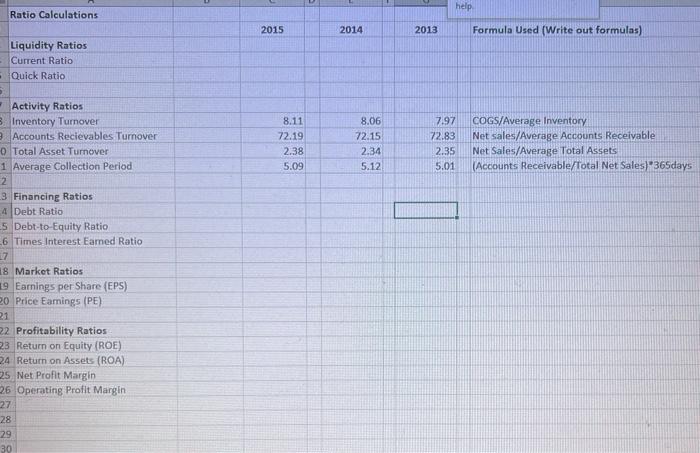
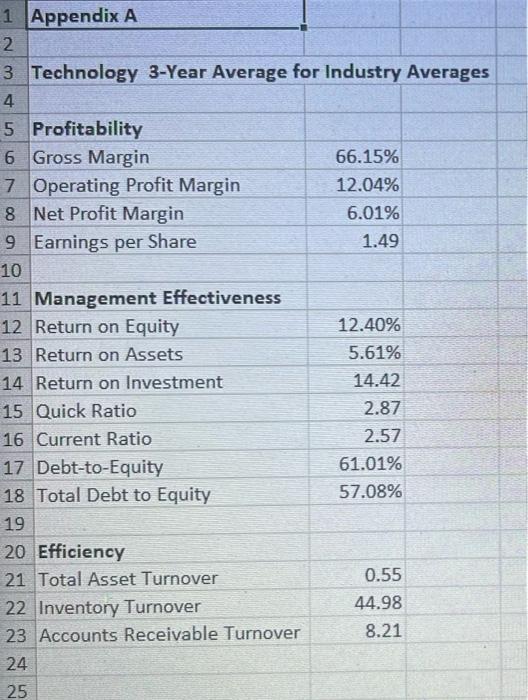
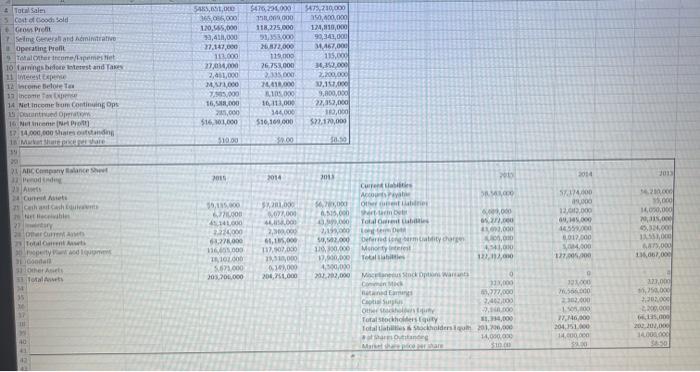
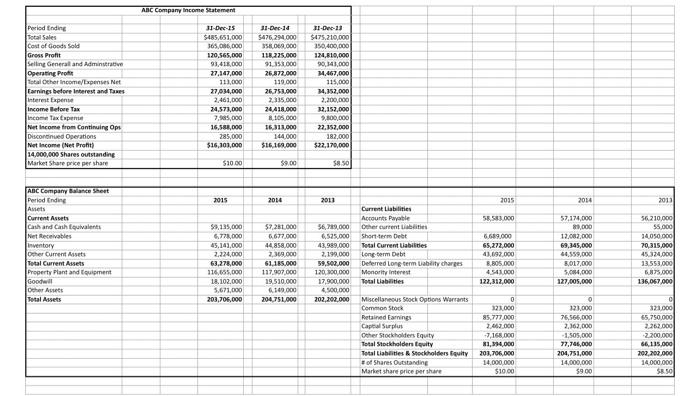
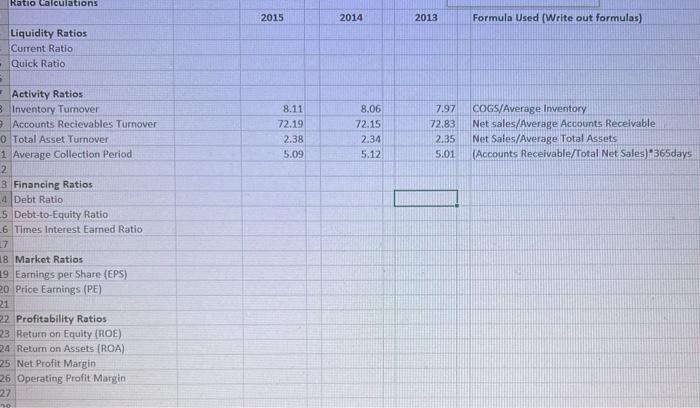
After your team has provided their input on the effect the acquisition will have on their department, perform an overall analysis to explain your recommendation to the CEO. Your analysis should include the following: Explain how the company is trending based on the year-over-year ratios. Compare the company to the industry average in Appendix A in the Excel workbook in areas of profitability, management effectiveness, and efficiency. Based on the above, summarize the pros and cons of ABC Company using both the year- over-year ratio analysis from Part 1 and the industry average comparisons from Part 3. Provide the team's final recommendation as to whether or not the CEO should invest in ABC Company. Ratio Calculations Liquidity Ratios Current Ratio Quick Ratio 8 Activity Ratios 3 Inventory Turnover 9 Accounts Recievables Turnover 0 Total Asset Turnover 1 Average Collection Period 2 3 Financing Ratios 4 Debt Ratio 5 Debt-to-Equity Ratio 6 Times Interest Earned Ratio 7 18 Market Ratios 19 Earnings per Share (EPS) 20 Price Earnings (PE) 21 22 Profitability Ratios 23 Return on Equity (ROE) 24 Return on Assets (ROA) 25 Net Profit Margin 26 Operating Profit Margin 27 28 29 30 2015 8.11 72.19 2.38 5.09 2014 8.06 72.15 2.34 5.12 help. 2013 Formula Used (Write out formulas) 7.97 COGS/Average Inventory 72.83 Net sales/Average Accounts Receivable 2.35 Net Sales/Average Total Assets 5.01 (Accounts Receivable/Total Net Sales)*365days HEH 1 Appendix A 2 3 Technology 3-Year Average for Industry Averages 4 5 Profitability 6 Gross Margin 66.15% 7 Operating Profit Margin 12.04% 8 Net Profit Margin 6.01% 9 Earnings per Share 1.49 10 11 Management Effectiveness 12 Return on Equity 12.40% 13 Return on Assets 5.61% 14 Return on Investment 14.42 15 Quick Ratio 2.87 16 Current Ratio 2.57 17 Debt-to-Equity 61.01% 18 Total Debt to Equity 57.08% 19 20 Efficiency 21 Total Asset Turnover 0.55 22 Inventory Turnover 44.98 23 Accounts Receivable Turnover 8.21 24 25 + Total Sales 3 Cost of Goods Sold Gross Profit Selmg General and Administrative Operating Profit 9 Total Other Income/lapemes tiet 10 farnings before Interest and Taxes 11 Interest Expense 12 income Belore Tex 13 Income Tax Expense 14 Net Income bum Continuing Ops 15 Dacontiued Operations 16 Net Income (Net Prot 17 14,000,000 Shares outstanding 18 Market Share price per share 39 21 ABC Company Balance Sheet Penod sandeg 23 Auets 24 Cunest Assets 25 Cesh and Cash Equivalents 26 Net Receivables tary 27 28 Other Current Assets 25 Total Current Assets operty Pant and Iqupmens 31 Goodall 31 Other Asiets 33 Total Assets 34 35 37 S 164 HE M 42 5485,651,000 $475,294,000 $475,730,000 365,086,000 158069,000 350,400,000 120,545,000 118,275,000 124,810,000 33,418,000 91,353,000 92,343,000 27.147,000 26.872,000 34,467,000 113,000 119,000 115,000 34,352,000 27,034,000 26.753.000 2,451,000 2,335,000 2,200,000 24,371,000 24,418,000 32,157,000 7,505,000 8,105,000 9,800,000 16,58,000 16,113,000 22,352,000 245,000 144,000 362,000 $22,170,000 $16,301,000 516,169,000 $10.00 50.50 2015 2014 15,135,000 $3,201,000 6,7710000 6077,000 45,141,000 44858,000 2.224,000 2,300,000 63278,000 41,185,000 116,405,000 117,907,000 18,102.000 13,310,000 610,000 5.673,000 205,700,000 204,251,000 2013 54,700,000 6,515,000 4,999,000 5,000 50,502,000 120,300,000 17,000,000 4,300,000 202,202,000 200 38.345,000 600,000 05,272,000 41,000,000 405,000 441,000 122,112,000 0 310,000 45,777,000 2402000 Current Liabilities Accounts Peyati Other pent Labirint Shert De Total Gaired abities Deferred Long term cabidity charge Monoty interest Total Liabilties Macetanus Stock Options Warrant Commen Mick taned tamnings Captial Sup Other Stockholper ny Total stockholders Equity $1,314,000 Total tables & Stockholders Equm 201,206,000 hutang 14,000,000 $10.00 Market share pice per share cons'e 2014 57.374,000 12,042,000 69,145,000 44559/000 8,017,000 5,004,000 come 000/500/221 121,000 76,566.000 2302,000 1505,800 27,146,000 204,151,000 14,000,000 $2.00 2013 24.210,000 15,000 14,050,000 20,315,000 4,324,000 14.551,000 6,875,000 136,067,000 323,000 $5,750,000 2,202,000 200,000 66,135,000 202,202,000 14,000,000 $8.50 Period Ending Total Sales Cost of Goods Sold Gross Profit Selling Generall and Administrative Operating Profit Total Other Income/Expenses Net Earnings before Interest and Taxes Interest Expense Income Before Tax Income Tax Expense Net Income from Continuing Ops Discontinued Operations Net Income (Net Profit) 14,000,000 Shares outstanding Market Share price per share ABC Company Balance Sheet Period Ending Assets Current Assets Cash and Cash Equivalents Net Receivables Inventory Other Current Assets Total Current Assets Property Plant and Equipment Goodwill Other Assets Total Assets ABC Company income Statement 31-Dec-15 $485,651,000 365,086,000 120,565,000 93,418,000 27,147,000 111,000 27,034,000 2,461,000 24,573,000 7,985,000 16,588,000 285,000 $16,303,000 $10.00 2015 59,135,000 6,778,000 45,141,000 2,224,000 63,278,000 116,655,000 18,102,000 5,671,000 203,706,000 31-Dec-14 $476,294,000 358,069,000 118,225,000 91,353,000 26,872,000 119.000 26,753,000 2,335,000 24,418,000 8,105,000 16,313,000 144,000 $16,169,000 $9.00 31-Dec-13 $475,210,000 350,400,000 124,810,000 90,343,000 34,467,000 115,000 34,352,000 2,200,000 32,152,000 9,800,000 22,352,000 182,000 $22,170,000 $8.50 2014 2013 $7,281,000 $6,789,000 6,677,000 6,525,000 44,858,000 43,989.000 2,369,000 2,199,000 61,185,000 59,502,000 117,907,000 120,300,000 19,510,000 6,149,000 204,751,000 202,202,000 17,900,000 4,500,000 Current Liabilities Accounts Payable Other current Uablites Short-term Debt Total Current Liabilities Long-term Debt Deferred Long term Liability charges Monority interest Total Liabilities Miscellaneous Stock Options Warrants Common Stock Retained Earnings Captal Surplus Other Stockholders Equity Total Stockholders Equity Total Liabilities & Stockholders Equity of Shares Outstanding Market share price per share 2015 58,583.000 6,689,000 65,272,000 43,692,000 8,805,000 4,543,000 122,312,000 0 323,000 85,777,000 2,462,000 -7,168,000 81,394,000 201,706,000 14,000,000 $10.00 2014 57,174,000 99,000 12,082,000 69,345,000 44,559,000 8,017,000 5,084,000 127,005,000 0 323,000 76,166,000 2,362,000 -1,505,000 77,746,000 204,751,000 14,000,000 $9.00 2013 56,210,000 $5,000 14.050.000 70,315,000 45,324,000 13,553,000 6.875.000 136,067,000 of 323.000 65,750,000 2,262,000 2,200,000 66,135,000 202,202,000 14,000,000 $8.50 Period Ending Total Sales Cost of Goods Sold Gross Profit Selling Generall and Adminstrative Operating Profi Total Other Income/Expenses Net Earnings before Interest and Taxes Interest Expense Income Before Tax Income Tax Expense Net Income from Continuing Ops Discontinued Operations Net Income (Net Profit) 14,000,000 Shares outstanding Market Share price per share ABC Company Balance Sheet Period Ending Assets Current Assets Cash and Cash Equivalents Net Receivables Inventory Other Current Assets Total Current Assets Property Plant and Equipment Goodwill Other Assets Total Assets ABC Company Income Statement 31-Dec-15 $485,651,000 365,086,000 120,565,000 93,418,000 27,147,000 113,000 27,034,000 2,461,000 24,573,000 7,585,000 16,588,000 285,000 $16,301,000 $10.00 2015 59,135,000 6,778,000 45,141,000 2,224,000 63,278,000 116,655,000 18,102.000 5,671,000 203,706,000 31-Dec-14 $476,294.000 358,060,000 118,225,000 91,353,000 26,872,000 119,000 26,753,000 2,335,000 24,418,000 8,105,000 16,313,000 144,000 $16,169,000 $9.00 2014 $7,281.000 6,677,000 44,858,000 2,349,000 61,185,000 117,907,000 19.510.000 6,149,000 204,751,000 31-Dec-13 $475,210.000 350,400,000 124,810,000 90,343,000 34,467,000 115,000 34,352,000 2,200,000 32,152,000 9,800,000 22,352,000 182,000 $22,170,000 $8.50 2013 56,789,000 6,525,000 43,989,000 2,199,000 59,502,000 120,300,000 17.900.000 4,500,000 202,202,000 Current Liabilities Accounts Payable Other current Liabilities Short-term Debt Total Current Liabilities Long-term Debt Deferred Long term Liability charges Monority interest Total Liabilities Miscellaneous Stock Options Warrants Common Stock Retained Earnings Captal Surplus Other Stockholders Equity Total Stockholders Equity Total Liabilities & Stockholders Equity #of Shares Outstanding Market share price per share 2015 58,583,000 6,689,000 65,272,000 43,692,000 8,805.000 4,541,000 122,312,000 0 323,000 85,777,000 2,462.000 -7,168,000 81,394,000 203,706,000 14,000,000 $10,00 2014 57,174,000 89,000 12,082,000 69,345,000 44,559,000 8,017,000 5,084,000 127,005,000 0 123,000 76,566,000 2,362,000 -1.505.000 77,746,000 204,751,000 14,000,000 $9.00 2013 56.210,000 $5,000 14,050,000 70,315,000 45,324,000 13.553,000 6,875,000 136,067,000 o 323,000 65,750,000 2.262.000 2,200,000 66,135,000 202,202,000 14,000,000 $8.50 Ratio Calculations Liquidity Ratios Current Ratio Quick Ratio 5 Activity Ratios 3 Inventory Turnover Accounts Recievables Turnover 0 Total Asset Turnover 1 Average Collection Period 2 3 Financing Ratios 4 Debt Ratio 5 Debt-to-Equity Ratio 6 Times Interest Earned Ratio 7 18 Market Ratios 19 Earnings per Share (EPS) 20 Price Earnings (PE) 21 22 Profitability Ratios 23 Return on Equity (ROE) 24 Return on Assets (ROA) 25 Net Profit Margin 26 Operating Profit Margin 27 20 2015 8.11 72.19 2.38 5.09 2014 8.06 72.15 2.34 5.12 Formula Used (Write out formulas) 7.97 COGS/Average Inventory 72.83 Net sales/Average Accounts Receivable 2.35 Net Sales/Average Total Assets 5.01 (Accounts Receivable/Total Net Sales)*365days HEL 2013 Provide the team's final recommendation as to whether or not the CEO should invest in ABC Company. After your team has provided their input on the effect the acquisition will have on their department, perform an overall analysis to explain your recommendation to the CEO. Your analysis should include the following: Explain how the company is trending based on the year-over-year ratios. Compare the company to the industry average in Appendix A in the Excel workbook in areas of profitability, management effectiveness, and efficiency. Based on the above, summarize the pros and cons of ABC Company using both the year- over-year ratio analysis from Part 1 and the industry average comparisons from Part 3. Provide the team's final recommendation as to whether or not the CEO should invest in ABC Company. Ratio Calculations Liquidity Ratios Current Ratio Quick Ratio 8 Activity Ratios 3 Inventory Turnover 9 Accounts Recievables Turnover 0 Total Asset Turnover 1 Average Collection Period 2 3 Financing Ratios 4 Debt Ratio 5 Debt-to-Equity Ratio 6 Times Interest Earned Ratio 7 18 Market Ratios 19 Earnings per Share (EPS) 20 Price Earnings (PE) 21 22 Profitability Ratios 23 Return on Equity (ROE) 24 Return on Assets (ROA) 25 Net Profit Margin 26 Operating Profit Margin 27 28 29 30 2015 8.11 72.19 2.38 5.09 2014 8.06 72.15 2.34 5.12 help. 2013 Formula Used (Write out formulas) 7.97 COGS/Average Inventory 72.83 Net sales/Average Accounts Receivable 2.35 Net Sales/Average Total Assets 5.01 (Accounts Receivable/Total Net Sales)*365days HEH 1 Appendix A 2 3 Technology 3-Year Average for Industry Averages 4 5 Profitability 6 Gross Margin 66.15% 7 Operating Profit Margin 12.04% 8 Net Profit Margin 6.01% 9 Earnings per Share 1.49 10 11 Management Effectiveness 12 Return on Equity 12.40% 13 Return on Assets 5.61% 14 Return on Investment 14.42 15 Quick Ratio 2.87 16 Current Ratio 2.57 17 Debt-to-Equity 61.01% 18 Total Debt to Equity 57.08% 19 20 Efficiency 21 Total Asset Turnover 0.55 22 Inventory Turnover 44.98 23 Accounts Receivable Turnover 8.21 24 25 + Total Sales 3 Cost of Goods Sold Gross Profit Selmg General and Administrative Operating Profit 9 Total Other Income/lapemes tiet 10 farnings before Interest and Taxes 11 Interest Expense 12 income Belore Tex 13 Income Tax Expense 14 Net Income bum Continuing Ops 15 Dacontiued Operations 16 Net Income (Net Prot 17 14,000,000 Shares outstanding 18 Market Share price per share 39 21 ABC Company Balance Sheet Penod sandeg 23 Auets 24 Cunest Assets 25 Cesh and Cash Equivalents 26 Net Receivables tary 27 28 Other Current Assets 25 Total Current Assets operty Pant and Iqupmens 31 Goodall 31 Other Asiets 33 Total Assets 34 35 37 S 164 HE M 42 5485,651,000 $475,294,000 $475,730,000 365,086,000 158069,000 350,400,000 120,545,000 118,275,000 124,810,000 33,418,000 91,353,000 92,343,000 27.147,000 26.872,000 34,467,000 113,000 119,000 115,000 34,352,000 27,034,000 26.753.000 2,451,000 2,335,000 2,200,000 24,371,000 24,418,000 32,157,000 7,505,000 8,105,000 9,800,000 16,58,000 16,113,000 22,352,000 245,000 144,000 362,000 $22,170,000 $16,301,000 516,169,000 $10.00 50.50 2015 2014 15,135,000 $3,201,000 6,7710000 6077,000 45,141,000 44858,000 2.224,000 2,300,000 63278,000 41,185,000 116,405,000 117,907,000 18,102.000 13,310,000 610,000 5.673,000 205,700,000 204,251,000 2013 54,700,000 6,515,000 4,999,000 5,000 50,502,000 120,300,000 17,000,000 4,300,000 202,202,000 200 38.345,000 600,000 05,272,000 41,000,000 405,000 441,000 122,112,000 0 310,000 45,777,000 2402000 Current Liabilities Accounts Peyati Other pent Labirint Shert De Total Gaired abities Deferred Long term cabidity charge Monoty interest Total Liabilties Macetanus Stock Options Warrant Commen Mick taned tamnings Captial Sup Other Stockholper ny Total stockholders Equity $1,314,000 Total tables & Stockholders Equm 201,206,000 hutang 14,000,000 $10.00 Market share pice per share cons'e 2014 57.374,000 12,042,000 69,145,000 44559/000 8,017,000 5,004,000 come 000/500/221 121,000 76,566.000 2302,000 1505,800 27,146,000 204,151,000 14,000,000 $2.00 2013 24.210,000 15,000 14,050,000 20,315,000 4,324,000 14.551,000 6,875,000 136,067,000 323,000 $5,750,000 2,202,000 200,000 66,135,000 202,202,000 14,000,000 $8.50 Period Ending Total Sales Cost of Goods Sold Gross Profit Selling Generall and Administrative Operating Profit Total Other Income/Expenses Net Earnings before Interest and Taxes Interest Expense Income Before Tax Income Tax Expense Net Income from Continuing Ops Discontinued Operations Net Income (Net Profit) 14,000,000 Shares outstanding Market Share price per share ABC Company Balance Sheet Period Ending Assets Current Assets Cash and Cash Equivalents Net Receivables Inventory Other Current Assets Total Current Assets Property Plant and Equipment Goodwill Other Assets Total Assets ABC Company income Statement 31-Dec-15 $485,651,000 365,086,000 120,565,000 93,418,000 27,147,000 111,000 27,034,000 2,461,000 24,573,000 7,985,000 16,588,000 285,000 $16,303,000 $10.00 2015 59,135,000 6,778,000 45,141,000 2,224,000 63,278,000 116,655,000 18,102,000 5,671,000 203,706,000 31-Dec-14 $476,294,000 358,069,000 118,225,000 91,353,000 26,872,000 119.000 26,753,000 2,335,000 24,418,000 8,105,000 16,313,000 144,000 $16,169,000 $9.00 31-Dec-13 $475,210,000 350,400,000 124,810,000 90,343,000 34,467,000 115,000 34,352,000 2,200,000 32,152,000 9,800,000 22,352,000 182,000 $22,170,000 $8.50 2014 2013 $7,281,000 $6,789,000 6,677,000 6,525,000 44,858,000 43,989.000 2,369,000 2,199,000 61,185,000 59,502,000 117,907,000 120,300,000 19,510,000 6,149,000 204,751,000 202,202,000 17,900,000 4,500,000 Current Liabilities Accounts Payable Other current Uablites Short-term Debt Total Current Liabilities Long-term Debt Deferred Long term Liability charges Monority interest Total Liabilities Miscellaneous Stock Options Warrants Common Stock Retained Earnings Captal Surplus Other Stockholders Equity Total Stockholders Equity Total Liabilities & Stockholders Equity of Shares Outstanding Market share price per share 2015 58,583.000 6,689,000 65,272,000 43,692,000 8,805,000 4,543,000 122,312,000 0 323,000 85,777,000 2,462,000 -7,168,000 81,394,000 201,706,000 14,000,000 $10.00 2014 57,174,000 99,000 12,082,000 69,345,000 44,559,000 8,017,000 5,084,000 127,005,000 0 323,000 76,166,000 2,362,000 -1,505,000 77,746,000 204,751,000 14,000,000 $9.00 2013 56,210,000 $5,000 14.050.000 70,315,000 45,324,000 13,553,000 6.875.000 136,067,000 of 323.000 65,750,000 2,262,000 2,200,000 66,135,000 202,202,000 14,000,000 $8.50 Period Ending Total Sales Cost of Goods Sold Gross Profit Selling Generall and Adminstrative Operating Profi Total Other Income/Expenses Net Earnings before Interest and Taxes Interest Expense Income Before Tax Income Tax Expense Net Income from Continuing Ops Discontinued Operations Net Income (Net Profit) 14,000,000 Shares outstanding Market Share price per share ABC Company Balance Sheet Period Ending Assets Current Assets Cash and Cash Equivalents Net Receivables Inventory Other Current Assets Total Current Assets Property Plant and Equipment Goodwill Other Assets Total Assets ABC Company Income Statement 31-Dec-15 $485,651,000 365,086,000 120,565,000 93,418,000 27,147,000 113,000 27,034,000 2,461,000 24,573,000 7,585,000 16,588,000 285,000 $16,301,000 $10.00 2015 59,135,000 6,778,000 45,141,000 2,224,000 63,278,000 116,655,000 18,102.000 5,671,000 203,706,000 31-Dec-14 $476,294.000 358,060,000 118,225,000 91,353,000 26,872,000 119,000 26,753,000 2,335,000 24,418,000 8,105,000 16,313,000 144,000 $16,169,000 $9.00 2014 $7,281.000 6,677,000 44,858,000 2,349,000 61,185,000 117,907,000 19.510.000 6,149,000 204,751,000 31-Dec-13 $475,210.000 350,400,000 124,810,000 90,343,000 34,467,000 115,000 34,352,000 2,200,000 32,152,000 9,800,000 22,352,000 182,000 $22,170,000 $8.50 2013 56,789,000 6,525,000 43,989,000 2,199,000 59,502,000 120,300,000 17.900.000 4,500,000 202,202,000 Current Liabilities Accounts Payable Other current Liabilities Short-term Debt Total Current Liabilities Long-term Debt Deferred Long term Liability charges Monority interest Total Liabilities Miscellaneous Stock Options Warrants Common Stock Retained Earnings Captal Surplus Other Stockholders Equity Total Stockholders Equity Total Liabilities & Stockholders Equity #of Shares Outstanding Market share price per share 2015 58,583,000 6,689,000 65,272,000 43,692,000 8,805.000 4,541,000 122,312,000 0 323,000 85,777,000 2,462.000 -7,168,000 81,394,000 203,706,000 14,000,000 $10,00 2014 57,174,000 89,000 12,082,000 69,345,000 44,559,000 8,017,000 5,084,000 127,005,000 0 123,000 76,566,000 2,362,000 -1.505.000 77,746,000 204,751,000 14,000,000 $9.00 2013 56.210,000 $5,000 14,050,000 70,315,000 45,324,000 13.553,000 6,875,000 136,067,000 o 323,000 65,750,000 2.262.000 2,200,000 66,135,000 202,202,000 14,000,000 $8.50 Ratio Calculations Liquidity Ratios Current Ratio Quick Ratio 5 Activity Ratios 3 Inventory Turnover Accounts Recievables Turnover 0 Total Asset Turnover 1 Average Collection Period 2 3 Financing Ratios 4 Debt Ratio 5 Debt-to-Equity Ratio 6 Times Interest Earned Ratio 7 18 Market Ratios 19 Earnings per Share (EPS) 20 Price Earnings (PE) 21 22 Profitability Ratios 23 Return on Equity (ROE) 24 Return on Assets (ROA) 25 Net Profit Margin 26 Operating Profit Margin 27 20 2015 8.11 72.19 2.38 5.09 2014 8.06 72.15 2.34 5.12 Formula Used (Write out formulas) 7.97 COGS/Average Inventory 72.83 Net sales/Average Accounts Receivable 2.35 Net Sales/Average Total Assets 5.01 (Accounts Receivable/Total Net Sales)*365days HEL 2013 Provide the team's final recommendation as to whether or not the CEO should invest in ABC Company