I only need help with the last writing part. I am including all of the information. 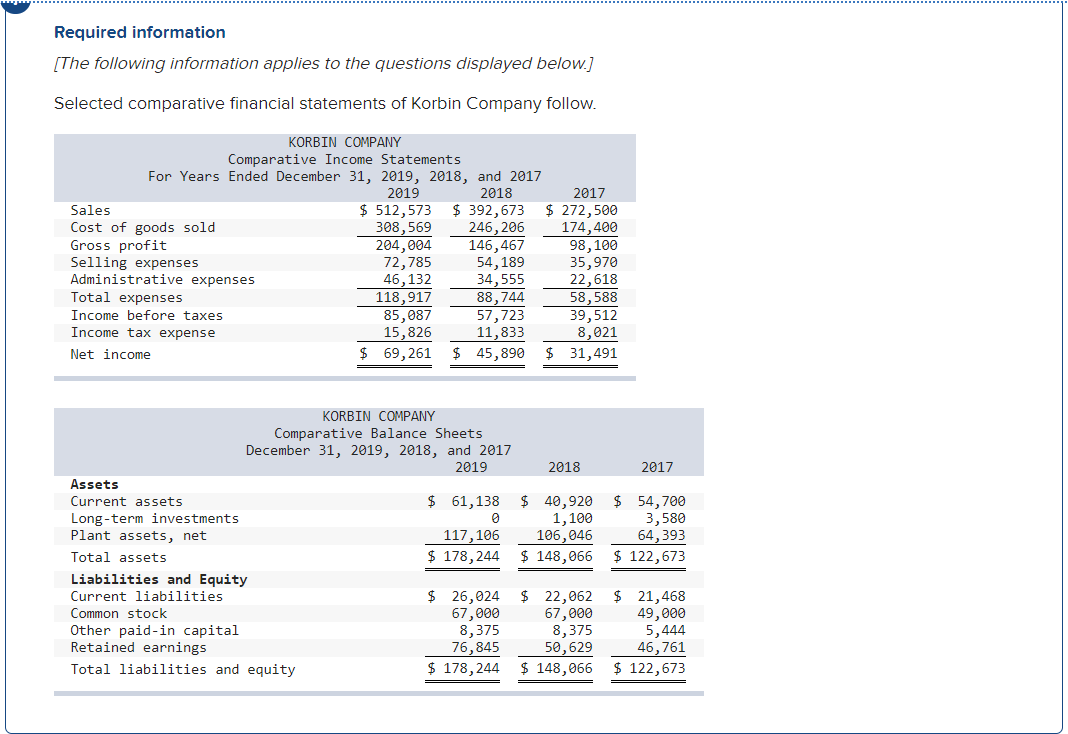
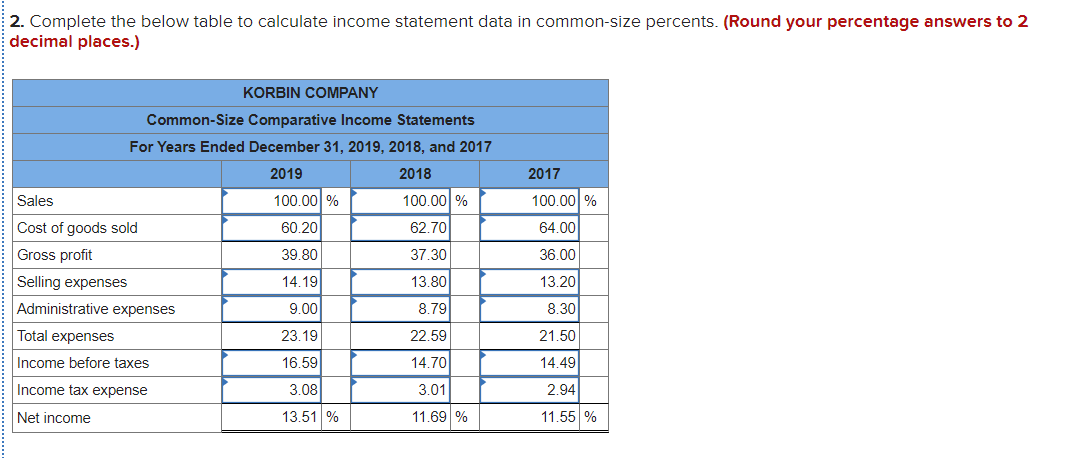
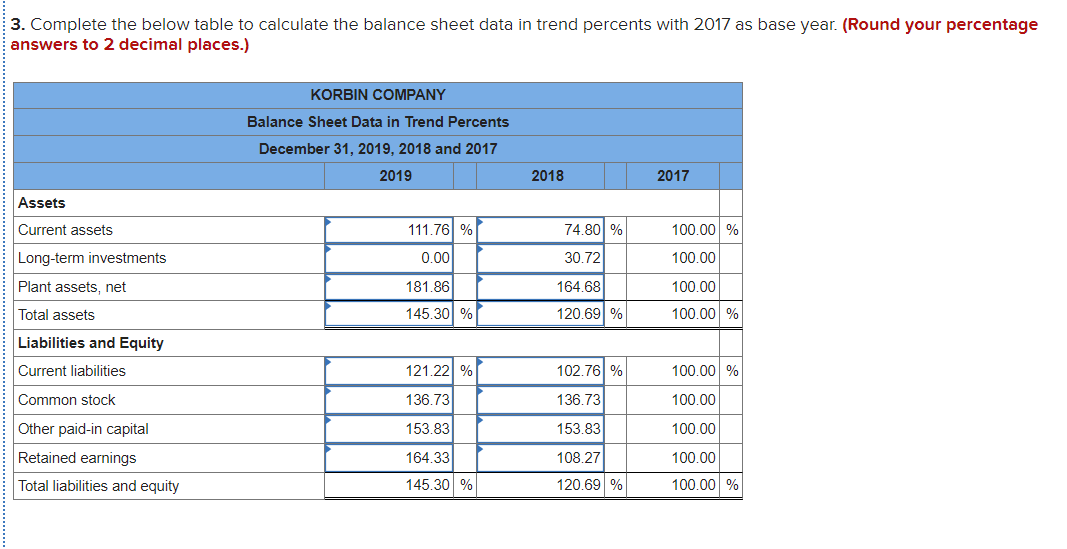
Required information [The following information applies to the questions displayed below.) Selected comparative financial statements of Korbin Company follow. KORBIN COMPANY Comparative Income Statements For Years Ended December 31, 2019, 2018, and 2017 2019 2018 2017 Sales $ 512,573 $ 392,673 $ 272,500 Cost of goods sold 308,569 246,206 174,400 Gross profit 204,004 146,467 98,100 Selling expenses 72,785 54,189 35,970 Administrative expenses 46,132 34,555 22,618 Total expenses 118,917 88,744 58,588 Income before taxes 85,087 57,723 39,512 Income tax expense 15,826 11,833 8,021 Net income $ 69,261 45,890 $ 31,491 2017 KORBIN COMPANY Comparative Balance Sheets December 31, 2019, 2018, and 2017 2019 2018 Assets Current assets $ 61,138 $ 40,920 Long-term investments 0 1,100 Plant assets, net 117,106 106,046 Total assets $ 178,244 $ 148,066 Liabilities and Equity Current liabilities $ 26,024 $ 22,062 Common stock 67,000 67,000 Other paid-in capital 8,375 8,375 Retained earnings 76,845 50,629 Total liabilities and equity $ 178,244 $ 148,066 $ 54,700 3,580 64,393 $ 122,673 $ 21,468 49,000 5,444 46,761 $ 122,673 2. Complete the below table to calculate income statement data in common-size percents. (Round your percentage answers to 2 decimal places.) 2017 100.00% 64.00 KORBIN COMPANY Common-Size Comparative Income Statements For Years Ended December 31, 2019, 2018, and 2017 2019 2018 Sales 100.00 % 100.00% Cost of goods sold 60.20 62.70 Gross profit 39.80 37.30 Selling expenses 14.19 13.80 Administrative expenses 9.00 8.79 Total expenses 23.19 22.59 Income before taxes 16.59 14.70 Income tax expense 3.08 3.01 Net income 13.51 % 11.69 % 36.00 13.20 8.30 21.50 14.49 2.94 11.55 % 3. Complete the below table to calculate the balance sheet data in trend percents with 2017 as base year. (Round your percentage answers to 2 decimal places.) KORBIN COMPANY Balance Sheet Data in Trend Percents December 31, 2019, 2018 and 2017 2019 2018 2017 Assets Current assets 111.76 % / 74.80 % 100.00 % Long-term investments 0.00 30.72 100.00 Plant assets, net 181.86 164.68 100.00 Total assets 145.30% 120.69 % 100.00 % Liabilities and Equity Current liabilities 121.221 % 102.76 % 100.00 % Common stock 136.73 136.73 100.00 Other paid-in capital 153.83 153.83 100.00 164.33 108.27 100.00 Retained earnings Total liabilities and equity 145.30 % 120.69 % 100.00 Observe the trends over the three years and the changes to the common-size percents you calculated in problems #1 & #2 for the Korbin Company. Comment on those changes with regard to the increase or decrease of the elements and their relation to how they affected other elements on the statements, i.e., gross profit, total assets, etc. Include the actual data you calculated from the problems to support your comments. (Your answer should approximate one-half page and encompass a few paragraphs on each statement type.) Essay Toolbar navigation B I U iii 1910