I post this question 3 times, but nobody answer this question. Could you do for me the step 1 &2 on excel, please? Thank
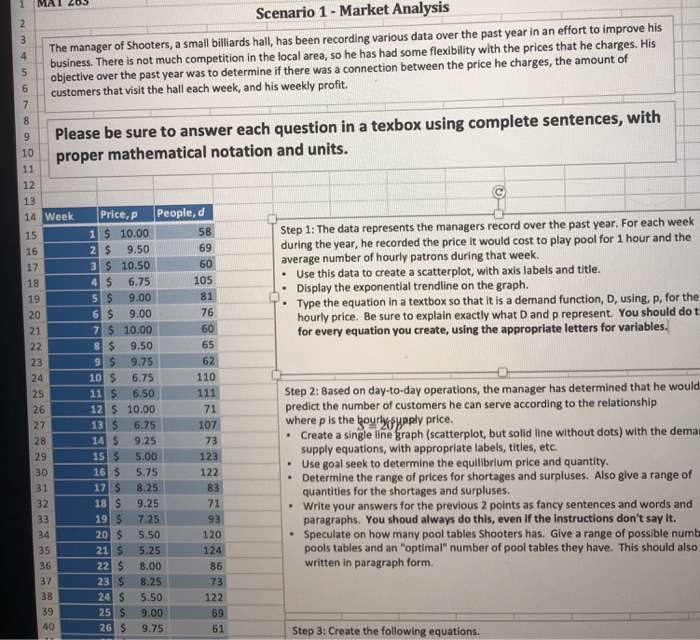
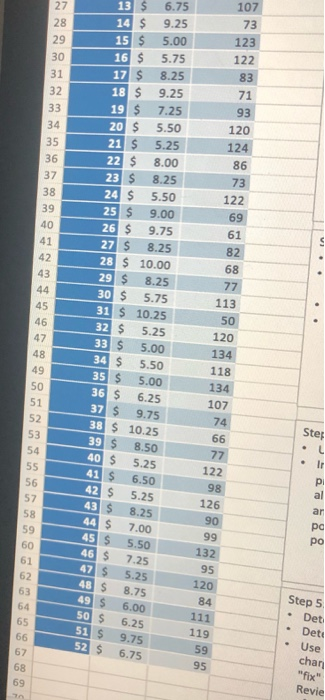
MA 2 3 4 . Scenario 1 - Market Analysis The manager of Shooters, a small billiards hall, has been recording various data over the past year in an effort to improve his business. There is not much competition in the local area, so he has had some flexibility with the prices that he charges. His 5 objective over the past year was to determine if there was a connection between the price he charges, the amount of 6 customers that visit the hall each week, and his weekly profit. 7 8 9 Please be sure to answer each question in a texbox using complete sentences, with 10 proper mathematical notation and units. 11 12 13 14 Week Price,P People, 15 1 $ 10.00 58 Step 1: The data represents the managers record over the past year. For each week 16 2 $ 9.50 69 during the year, he recorded the price it would cost to play pool for 1 hour and the 17 3 $ 10.50 60 average number of hourly patrons during that week. 18 Use this data to create a scatterplot, with axis labels and title. 4 S 6.75 105 Display the exponential trendline on the graph. 19 5 $ 9.00 81 Type the equation in a textbox so that it is a demand function, D, using, p, for the 20 6 $ 9.00 76 hourly price. Be sure to explain exactly what D and p represent. You should do ti 21 7 $ 10.00 60 for every equation you create, using the appropriate letters for variables. 22 8 $ 9.50 65 23 9 $ 9.75 62 24 10 $ 6.75 110 25 11 $ 6.50 111 Step 2: Based on day-to-day operations, the manager has determined that he would 26 12 $ 10.00 71 predict the number of customers he can serve according to the relationship 27 13 $ 6.75 107 where p is the pour crypply price. 28 14 $ 9.25 73 Create a single line graph (scatterplot, but solid line without dots) with the deman 29 15 $ supply equations, with appropriate labels, titles, etc. 5.00 123 30 16 $ Use goal seek to determine the equilibrium price and quantity. 5.75 122 Determine the range of prices for shortages and surpluses. Also give a range of 31 17 $ 8.25 83 quantities for the shortages and surpluses. 32 18 $ 9.25 71 Write your answers for the previous 2 points as fancy sentences and words and 33 19 $ 7.25 93 paragraphs. You shoud always do this, even if the instructions don't say it. 34 20 $ 5.50 120 Speculate on how many pool tables Shooters has. Give a range of possible numb 35 21 $ 5.25 124 pools tables and an "optimal number of pool tables they have. This should also 36 22 $ 8.00 86 written in paragraph form. 37 23 $ 8.25 73 38 24 $ 5.50 122 39 25 $ 9.00 69 40 26 $ 9.75 61 Step 3: Create the following equations. . . 107 27 28 29 30 73 123 122 83 71 31 32 33 93 34 13 $ 6.75 14 $ 9.25 15 $ 5.00 16 $ 5.75 17 $ 8.25 18 $ 9.25 19 $ 7.25 20 s 5.50 21 $ 5.25 22 $ 8.00 23 $ 8.25 24 s 5.50 25 S 9.00 26 $ 9.75 27 s 8.25 120 124 86 73 122 69 61 82 68 35 36 37 38 39 40 41 42 43 44 45 46 47 48 49 50 51 52 53 Stef 28 $ 10.00 29 $ 8.25 30 $ 5.75 31 $ 10.25 32 $ 5.25 33 $ 5.00 34 $ 5.50 35 $ 5.00 36 $ 6.25 37 $ 9.75 38 $ 10.25 39 $ 8.50 40 $ 5.25 41 $ 6.50 42 $ 5.25 43 $ 8.25 44 7.00 45 $ 5.50 46 $ 7.25 47 $ 5.25 48 S 8.75 49 $ 50 $ 51 $ 52 $ . 54 55 56 57 58 59 60 61 I 77 113 50 120 134 118 134 107 74 66 77 122 98 126 90 99 132 95 120 84 111 119 59 95 pi al ar 62 63 64 65 66 67 68 69 6.00 6.25 9.75 6.75 Step 5 Det Deti Use chan "fix" Revie MA 2 3 4 . Scenario 1 - Market Analysis The manager of Shooters, a small billiards hall, has been recording various data over the past year in an effort to improve his business. There is not much competition in the local area, so he has had some flexibility with the prices that he charges. His 5 objective over the past year was to determine if there was a connection between the price he charges, the amount of 6 customers that visit the hall each week, and his weekly profit. 7 8 9 Please be sure to answer each question in a texbox using complete sentences, with 10 proper mathematical notation and units. 11 12 13 14 Week Price,P People, 15 1 $ 10.00 58 Step 1: The data represents the managers record over the past year. For each week 16 2 $ 9.50 69 during the year, he recorded the price it would cost to play pool for 1 hour and the 17 3 $ 10.50 60 average number of hourly patrons during that week. 18 Use this data to create a scatterplot, with axis labels and title. 4 S 6.75 105 Display the exponential trendline on the graph. 19 5 $ 9.00 81 Type the equation in a textbox so that it is a demand function, D, using, p, for the 20 6 $ 9.00 76 hourly price. Be sure to explain exactly what D and p represent. You should do ti 21 7 $ 10.00 60 for every equation you create, using the appropriate letters for variables. 22 8 $ 9.50 65 23 9 $ 9.75 62 24 10 $ 6.75 110 25 11 $ 6.50 111 Step 2: Based on day-to-day operations, the manager has determined that he would 26 12 $ 10.00 71 predict the number of customers he can serve according to the relationship 27 13 $ 6.75 107 where p is the pour crypply price. 28 14 $ 9.25 73 Create a single line graph (scatterplot, but solid line without dots) with the deman 29 15 $ supply equations, with appropriate labels, titles, etc. 5.00 123 30 16 $ Use goal seek to determine the equilibrium price and quantity. 5.75 122 Determine the range of prices for shortages and surpluses. Also give a range of 31 17 $ 8.25 83 quantities for the shortages and surpluses. 32 18 $ 9.25 71 Write your answers for the previous 2 points as fancy sentences and words and 33 19 $ 7.25 93 paragraphs. You shoud always do this, even if the instructions don't say it. 34 20 $ 5.50 120 Speculate on how many pool tables Shooters has. Give a range of possible numb 35 21 $ 5.25 124 pools tables and an "optimal number of pool tables they have. This should also 36 22 $ 8.00 86 written in paragraph form. 37 23 $ 8.25 73 38 24 $ 5.50 122 39 25 $ 9.00 69 40 26 $ 9.75 61 Step 3: Create the following equations. . . 107 27 28 29 30 73 123 122 83 71 31 32 33 93 34 13 $ 6.75 14 $ 9.25 15 $ 5.00 16 $ 5.75 17 $ 8.25 18 $ 9.25 19 $ 7.25 20 s 5.50 21 $ 5.25 22 $ 8.00 23 $ 8.25 24 s 5.50 25 S 9.00 26 $ 9.75 27 s 8.25 120 124 86 73 122 69 61 82 68 35 36 37 38 39 40 41 42 43 44 45 46 47 48 49 50 51 52 53 Stef 28 $ 10.00 29 $ 8.25 30 $ 5.75 31 $ 10.25 32 $ 5.25 33 $ 5.00 34 $ 5.50 35 $ 5.00 36 $ 6.25 37 $ 9.75 38 $ 10.25 39 $ 8.50 40 $ 5.25 41 $ 6.50 42 $ 5.25 43 $ 8.25 44 7.00 45 $ 5.50 46 $ 7.25 47 $ 5.25 48 S 8.75 49 $ 50 $ 51 $ 52 $ . 54 55 56 57 58 59 60 61 I 77 113 50 120 134 118 134 107 74 66 77 122 98 126 90 99 132 95 120 84 111 119 59 95 pi al ar 62 63 64 65 66 67 68 69 6.00 6.25 9.75 6.75 Step 5 Det Deti Use chan "fix" Revie