

Answered step by step
Verified Expert Solution
Question
1 Approved Answer
I posted the question previously and it was answered, but I want to draw the relationship between the two variables, please Ques.9) Apply Pearson's r
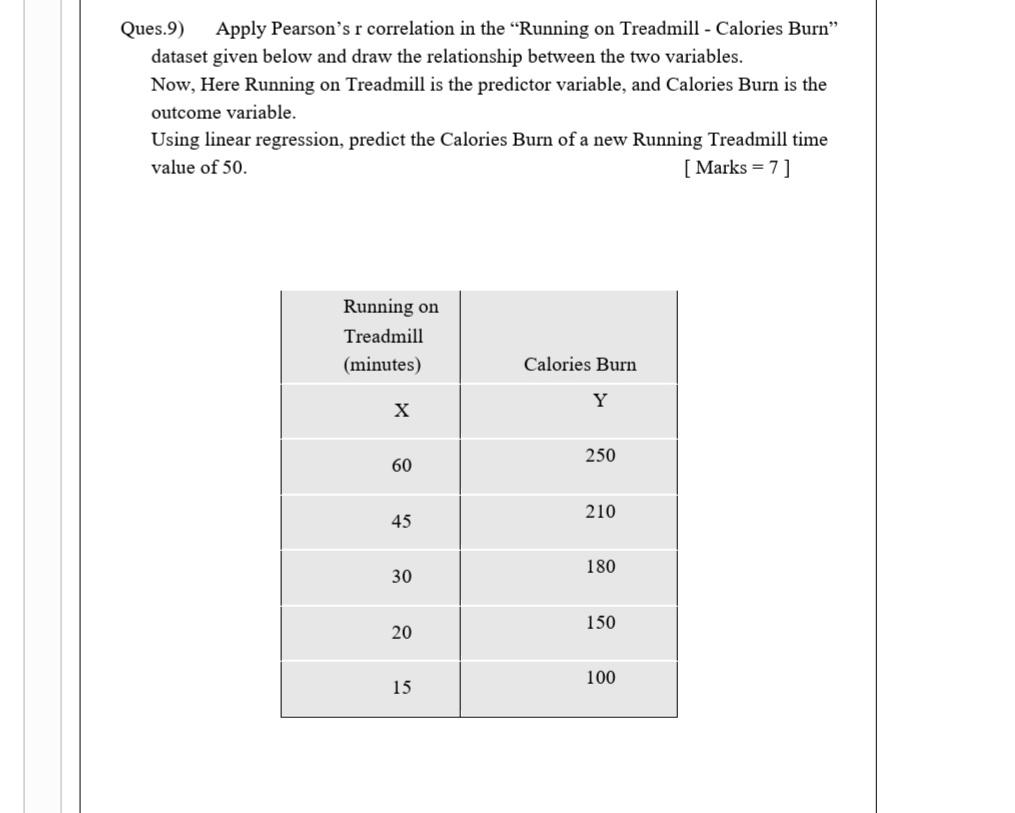
I posted the question previously and it was answered, but I want to draw the relationship between the two variables, pleaseQues.9) Apply Pearson's r correlation in the "Running on Treadmill - Calories Burn" dataset given below and draw the relationship between the two variables. Now, Here Running on Treadmill is the predictor variable, and Calories Burn is the outcome variable. Using linear regression, predict the Calories Burn of a new Running Treadmill time value of 50 . [Marks =7 ]
Step by Step Solution
There are 3 Steps involved in it
Step: 1

Get Instant Access to Expert-Tailored Solutions
See step-by-step solutions with expert insights and AI powered tools for academic success
Step: 2

Step: 3
Ace Your Homework with AI
Get the answers you need in no time with our AI-driven, step-by-step assistance
Get Started
Objects And Databases Third International Conference Icoodb 2010 Frankfurt/Main Germany September 28 30 2010 Proceedings Lncs 6348
Authors: Alan Dearle ,Roberto V. Zicari
2010th Edition
3642160913, 978-3642160912