I rally need help with this lab. I tried but could not understand it.
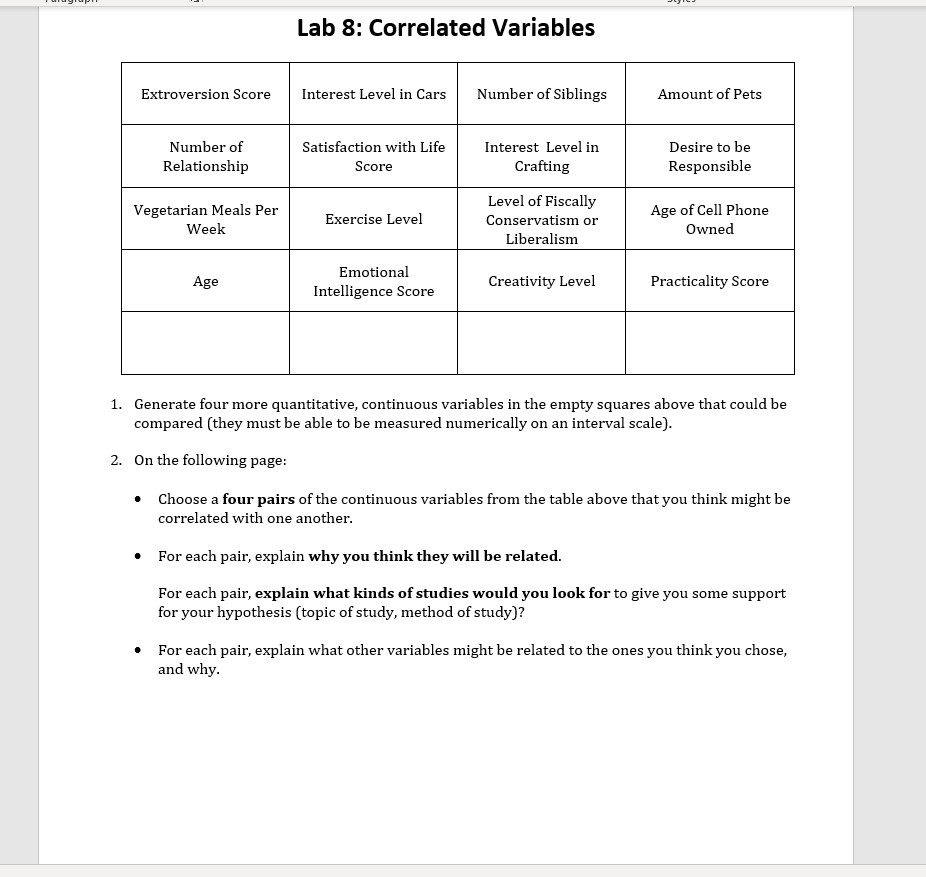
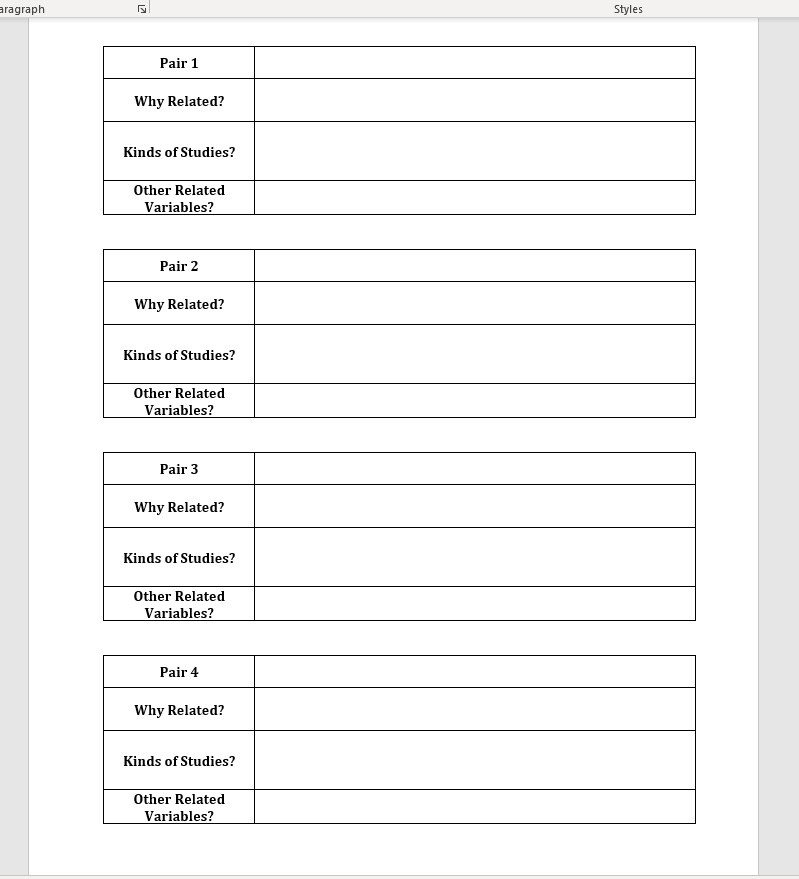
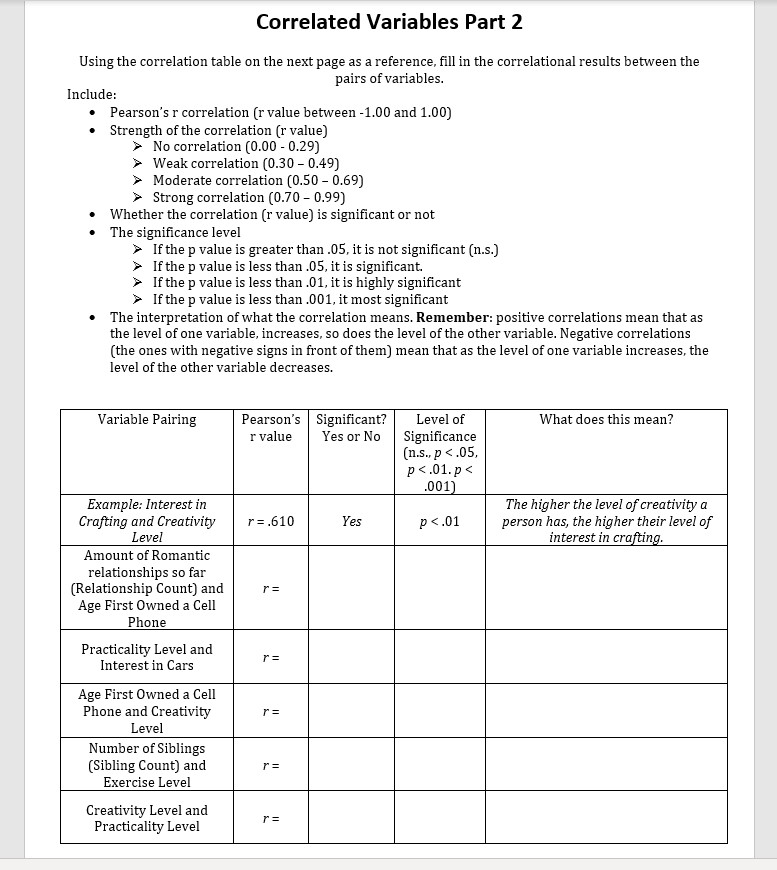
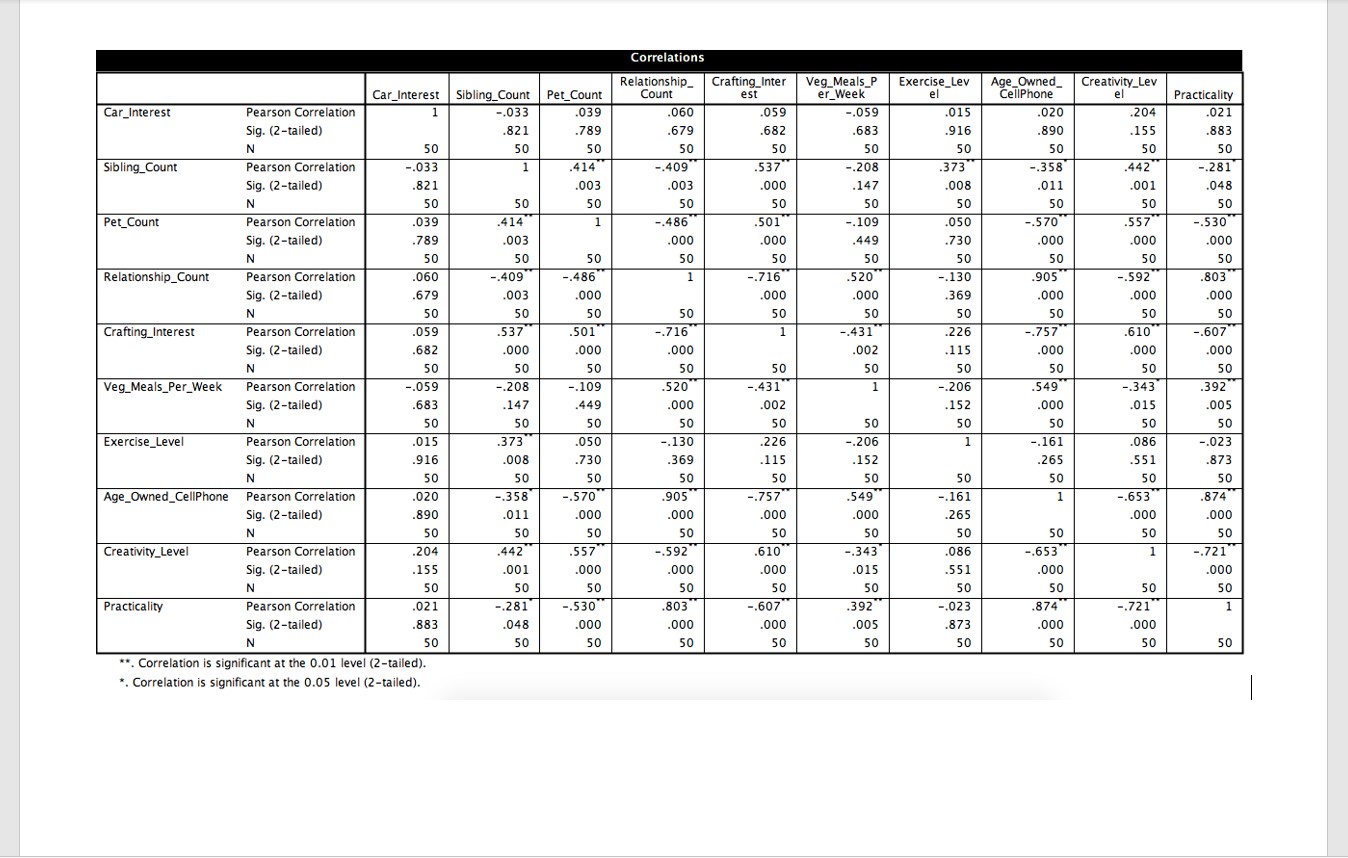
Lab 8: Correlated Variables Extroversion Score Interest Level in Cars Number of Siblings Amount of Pets Number of Satisfaction with Life Interest Level in Desire to be Relationship Score Crafting Responsible Level of Fiscally Vegetarian Meals Per Age of Cell Phone Exercise Level Conservatism or Week Owned Liberalism Emotional Age Creativity Level Practicality Score Intelligence Score 1. Generate four more quantitative, continuous variables in the empty squares above that could be compared (they must be able to be measured numerically on an interval scale). 2. On the following page: Choose a four pairs of the continuous variables from the table above that you think might be correlated with one another. For each pair, explain why you think they will be related. For each pair, explain what kinds of studies would you look for to give you some support for your hypothesis (topic of study, method of study)? For each pair, explain what other variables might be related to the ones you think you chose, and why.aragraph Styles Pair 1 Why Related? Kinds of Studies? Other Related Variables? Pair 2 Why Related? Kinds of Studies? Other Related Variables? Pair 3 Why Related? Kinds of Studies? Other Related Variables? Pair 4 Why Related? Kinds of Studies? Other Related Variables?Correlated Variables Part 2 Using the correlation table on the next page as a reference, fill in the correlational results between the pairs of variables. Include: Pearson's r correlation (r value between -1.00 and 1.00) Strength of the correlation (r value) No correlation (0.00 - 0.29) >Weak correlation (0.30 - 0.49) Moderate correlation (0.50 - 0.69) Strong correlation (0.70 - 0.99) Whether the correlation (r value) is significant or not The significance level >If the p value is greater than .05, it is not significant (n.s.) >If the p value is less than .05, it is significant. >If the p value is less than .01, it is highly significant >If the p value is less than .001, it most significant The interpretation of what the correlation means. Remember: positive correlations mean that as the level of one variable, increases, so does the level of the other variable. Negative correlations (the ones with negative signs in front of them) mean that as the level of one variable increases, the level of the other variable decreases. Variable Pairing Pearson's Significant? Level of What does this mean? r value Yes or No Significance (n.s., p <.05 p example: interest in the higher level of creativity a crafting and r=".610" yes person has their crafting. amount romantic relationships so far count first owned cell phone practicality cars number siblings relationship_ crafting_inter veg_meals_p exercise_lev age_owned_ creativity_lev car_interest sibling_count pet_count est er_week el cellphone pearson correlation ..059 sig. .789 .883 n .003 .048 .570 .000 relationship_count .905 .679 crafting_interest .682 .002 .115 veg_meals_per_week .683 .147 .015 exercise_level .130 .206 .008 .369 .152 age_owned_cellphone creativity_level .155 .001 .281 .005 .873 is significant at>


