I really need help please !!
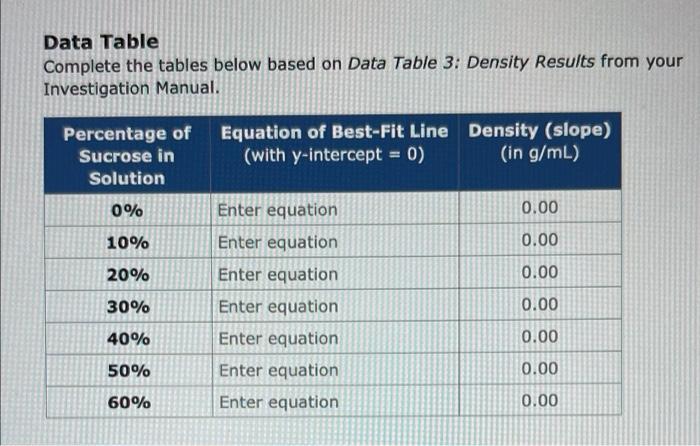
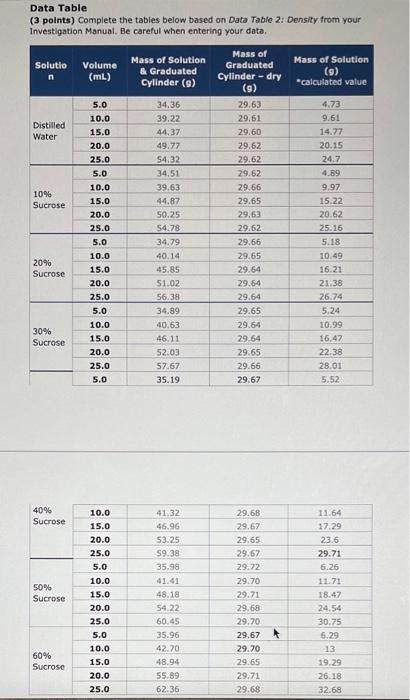
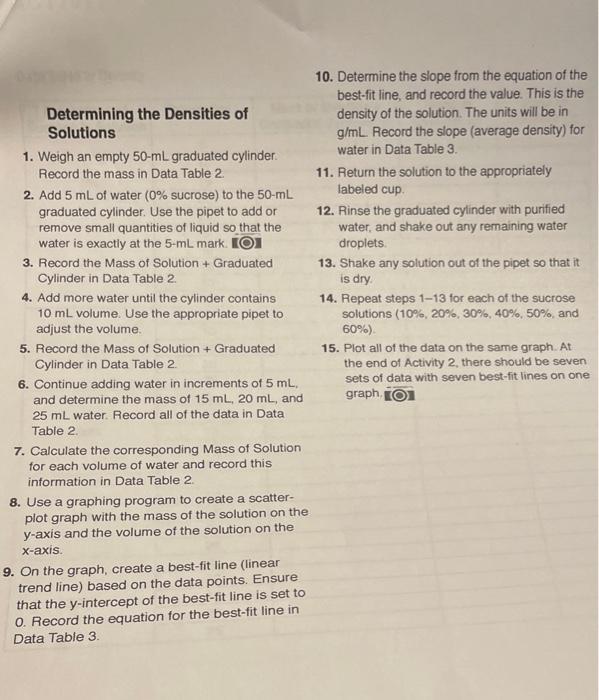
Data Table Complete the tables below based on Data Table 3: Density Results from your Investigation Manual. Percentage of Sucrose in Solution Equation of Best-Fit Line Density (slope) (with y-intercept = 0) (in g/mL) 0% 0.00 10% 0.00 Enter equation Enter equation Enter equation Enter equation 20% 0.00 30% 0.00 40% Enter equation 0.00 50% 0.00 Enter equation Enter equation 60% 0.00 Data Table (3 points) Complete the tables below based on Data Table 2: Density from your Investigation Manual. Be careful when entering your data, Solutio Volume (mL) Mass of Solution & Graduated Cylinder (9) Mass of Graduated Cylinder -dry Mass of Solution (9) *calculated value (9) Distilled Water 1096 Sucrose 5.0 10.0 15.0 20.0 25.0 5.0 10.0 15.0 20.0 25.0 5.0 10.0 15.0 20.0 25.0 5.0 10.0 15.0 20.0 25.0 5.0 34.36 39.22 44.37 49.77 54.32 34.51 39.63 44.87 50.25 54.78 34.79 40.14 45.85 51.02 56.38 34.89 40.63 46.11 52.03 57.67 35.19 29.63 29.61 29.60 29.62 29.62 29.62 29.66 29.65 29.63 29.62 29.66 29.65 29.64 29.64 29.64 29.65 29.64 29.64 29.65 29.66 29.67 4.73 9.61 14.77 20.15 24.7 4.89 9.97 15.22 20.62 25.16 5.18 10.49 16.21 21.38 26.74 5.24 10.99 16,47 22.38 28.01 5.52 20% Sucrose 30% Sucrose 40% Sucrose 50% Sucrose 10.0 15.0 20.0 25.0 5.0 10.0 15.0 20.0 25.0 5.0 10.0 15.0 20.0 25.0 41.32 46.96 53.25 59.38 35.98 41.41 48.18 54.22 60.45 35.96 42.70 48.94 55.89 62.36 29.68 29.67 29.65 29.67 29.72 29.70 29.71 29.68 29.70 29.67 29.70 29.65 29.71 29.68 11.64 17:29 23.6 29.71 6.26 11.71 18.47 24.54 30.75 6.29 13 19.29 26.18 32.68 60% Sucrose Determining the Densities of Solutions 1. Weigh an empty 50-ml graduated cylinder Record the mass in Data Table 2. 2. Add 5 mL of water (0% sucrose) to the 50-ml graduated cylinder. Use the pipet to add or remove small quantities of liquid so that the water is exactly at the 5-ml mark. TOI 3. Record the Mass of Solution + Graduated Cylinder in Data Table 2. 4. Add more water until the cylinder contains 10 mL volume. Use the appropriate pipet to adjust the volume 5. Record the Mass of Solution + Graduated Cylinder in Data Table 2. 6. Continue adding water in increments of 5 ml, and determine the mass of 15 mL, 20 mL, and 25 mL water. Record all of the data in Data Table 2 7. Calculate the corresponding Mass of Solution for each volume of water and record this information in Data Table 2 8. Use a graphing program to create a scatter- plot graph with the mass of the solution on the y-axis and the volume of the solution on the x-axis. 9. On the graph, create a best-fit line (linear trend line) based on the data points. Ensure that the y-intercept of the best-fit line is set to 0. Record the equation for the best-fit line in Data Table 3 10. Determine the slope from the equation of the best-fit line, and record the value. This is the density of the solution. The units will be in g/mL. Record the slope (average density) for water in Data Table 3. 11. Return the solution to the appropriately labeled cup 12. Rinse the graduated cylinder with purified water, and shake out any remaining water droplets. 13. Shake any solution out of the pipet so that it is dry 14. Repeat steps 113 for each of the sucrose solutions (10% 20% 30%, 40%, 50%, and 60%) 15. Plot all of the data on the same graph. At the end of Activity 2. there should be seven sets of data with seven best-fit lines on one graph. Loi


