Answered step by step
Verified Expert Solution
Link Copied!

Question

1 Approved Answer

I really need help understanding how you get the numbers. Using the six months of data provided in the Excel data file , simulate the

I really need help understanding how you get the numbers.

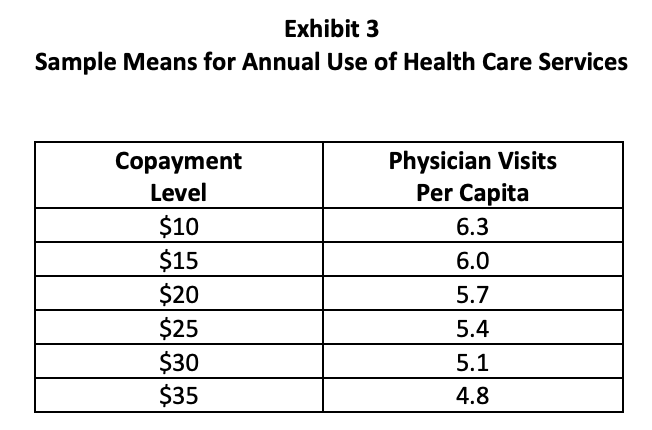
Using the six months of data provided in the Excel data file, simulate the profitability of the physician services department if copayments are increased to $20 per visit. Repeat your analysis using a copayment of $25 per visit.
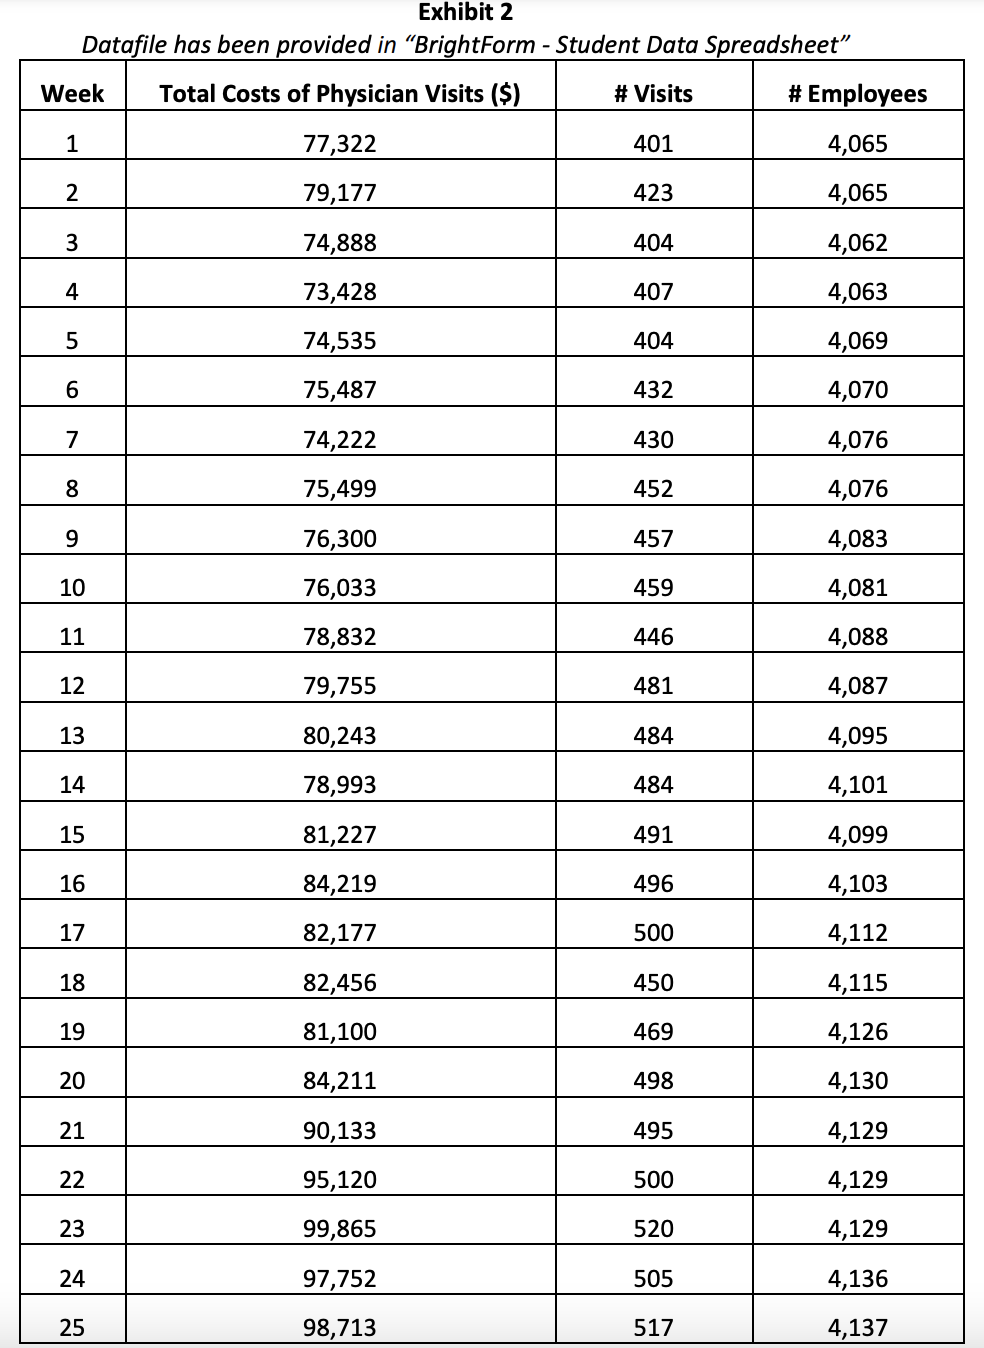
image text in transcribed

Additional Information if needed:

image text in transcribed

Exhibit 2 Datafile has been provided in BrightForm - Student Data Spreadsheet" Week Total Costs of Physician Visits ($) # Visits # Employees 1 77,322 401 4,065 2 79,177 423 4,065 3 74,888 404 4,062 4 73,428 407 4,063 5 74,535 404 4,069 6 75,487 432 4,070 7 74,222 430 4,076 8 75,499 452 4,076 9 76,300 457 4,083 10 76,033 459 4,081 11 78,832 446 4,088 12 79,755 481 4,087 13 80,243 484 4,095 14 78,993 484 4,101 15 81,227 491 4,099 16 84,219 496 4,103 17 82,177 500 4,112 18 82,456 450 4,115 19 81,100 469 4,126 20 84,211 498 4,130 21 90,133 495 4,129 22 95,120 500 4,129 23 99,865 520 4,129 24 97,752 505 4,136 25 98,713 517 4,137 Exhibit 3 Sample Means for Annual Use of Health Care Services Copayment Level $10 $15 $20 $25 $30 $35 Physician Visits Per Capita 6.3 6.0 5.7 5.4 5.1 4.8 Exhibit 2 Datafile has been provided in BrightForm - Student Data Spreadsheet" Week Total Costs of Physician Visits ($) # Visits # Employees 1 77,322 401 4,065 2 79,177 423 4,065 3 74,888 404 4,062 4 73,428 407 4,063 5 74,535 404 4,069 6 75,487 432 4,070 7 74,222 430 4,076 8 75,499 452 4,076 9 76,300 457 4,083 10 76,033 459 4,081 11 78,832 446 4,088 12 79,755 481 4,087 13 80,243 484 4,095 14 78,993 484 4,101 15 81,227 491 4,099 16 84,219 496 4,103 17 82,177 500 4,112 18 82,456 450 4,115 19 81,100 469 4,126 20 84,211 498 4,130 21 90,133 495 4,129 22 95,120 500 4,129 23 99,865 520 4,129 24 97,752 505 4,136 25 98,713 517 4,137 Exhibit 3 Sample Means for Annual Use of Health Care Services Copayment Level $10 $15 $20 $25 $30 $35 Physician Visits Per Capita 6.3 6.0 5.7 5.4 5.1 4.8

Step by Step Solution

There are 3 Steps involved in it

Step: 1

blur-text-image

Get Instant Access to Expert-Tailored Solutions

See step-by-step solutions with expert insights and AI powered tools for academic success

Step: 2

blur-text-image_2

Step: 3

blur-text-image_3

Ace Your Homework with AI

Get the answers you need in no time with our AI-driven, step-by-step assistance

Get Started

Recommended Textbook for

Marketing Audit Checklists A Guide To Effective Marketing Resource Realization

Authors: Aubrey Wilson

1st Edition

0077077601, 978-0077077600

More Books

Students also viewed these Accounting questions

Question

How effective were your meetings? Explain.

Answered: 1 week ago