I really need help with these questions, I can not figure them out.
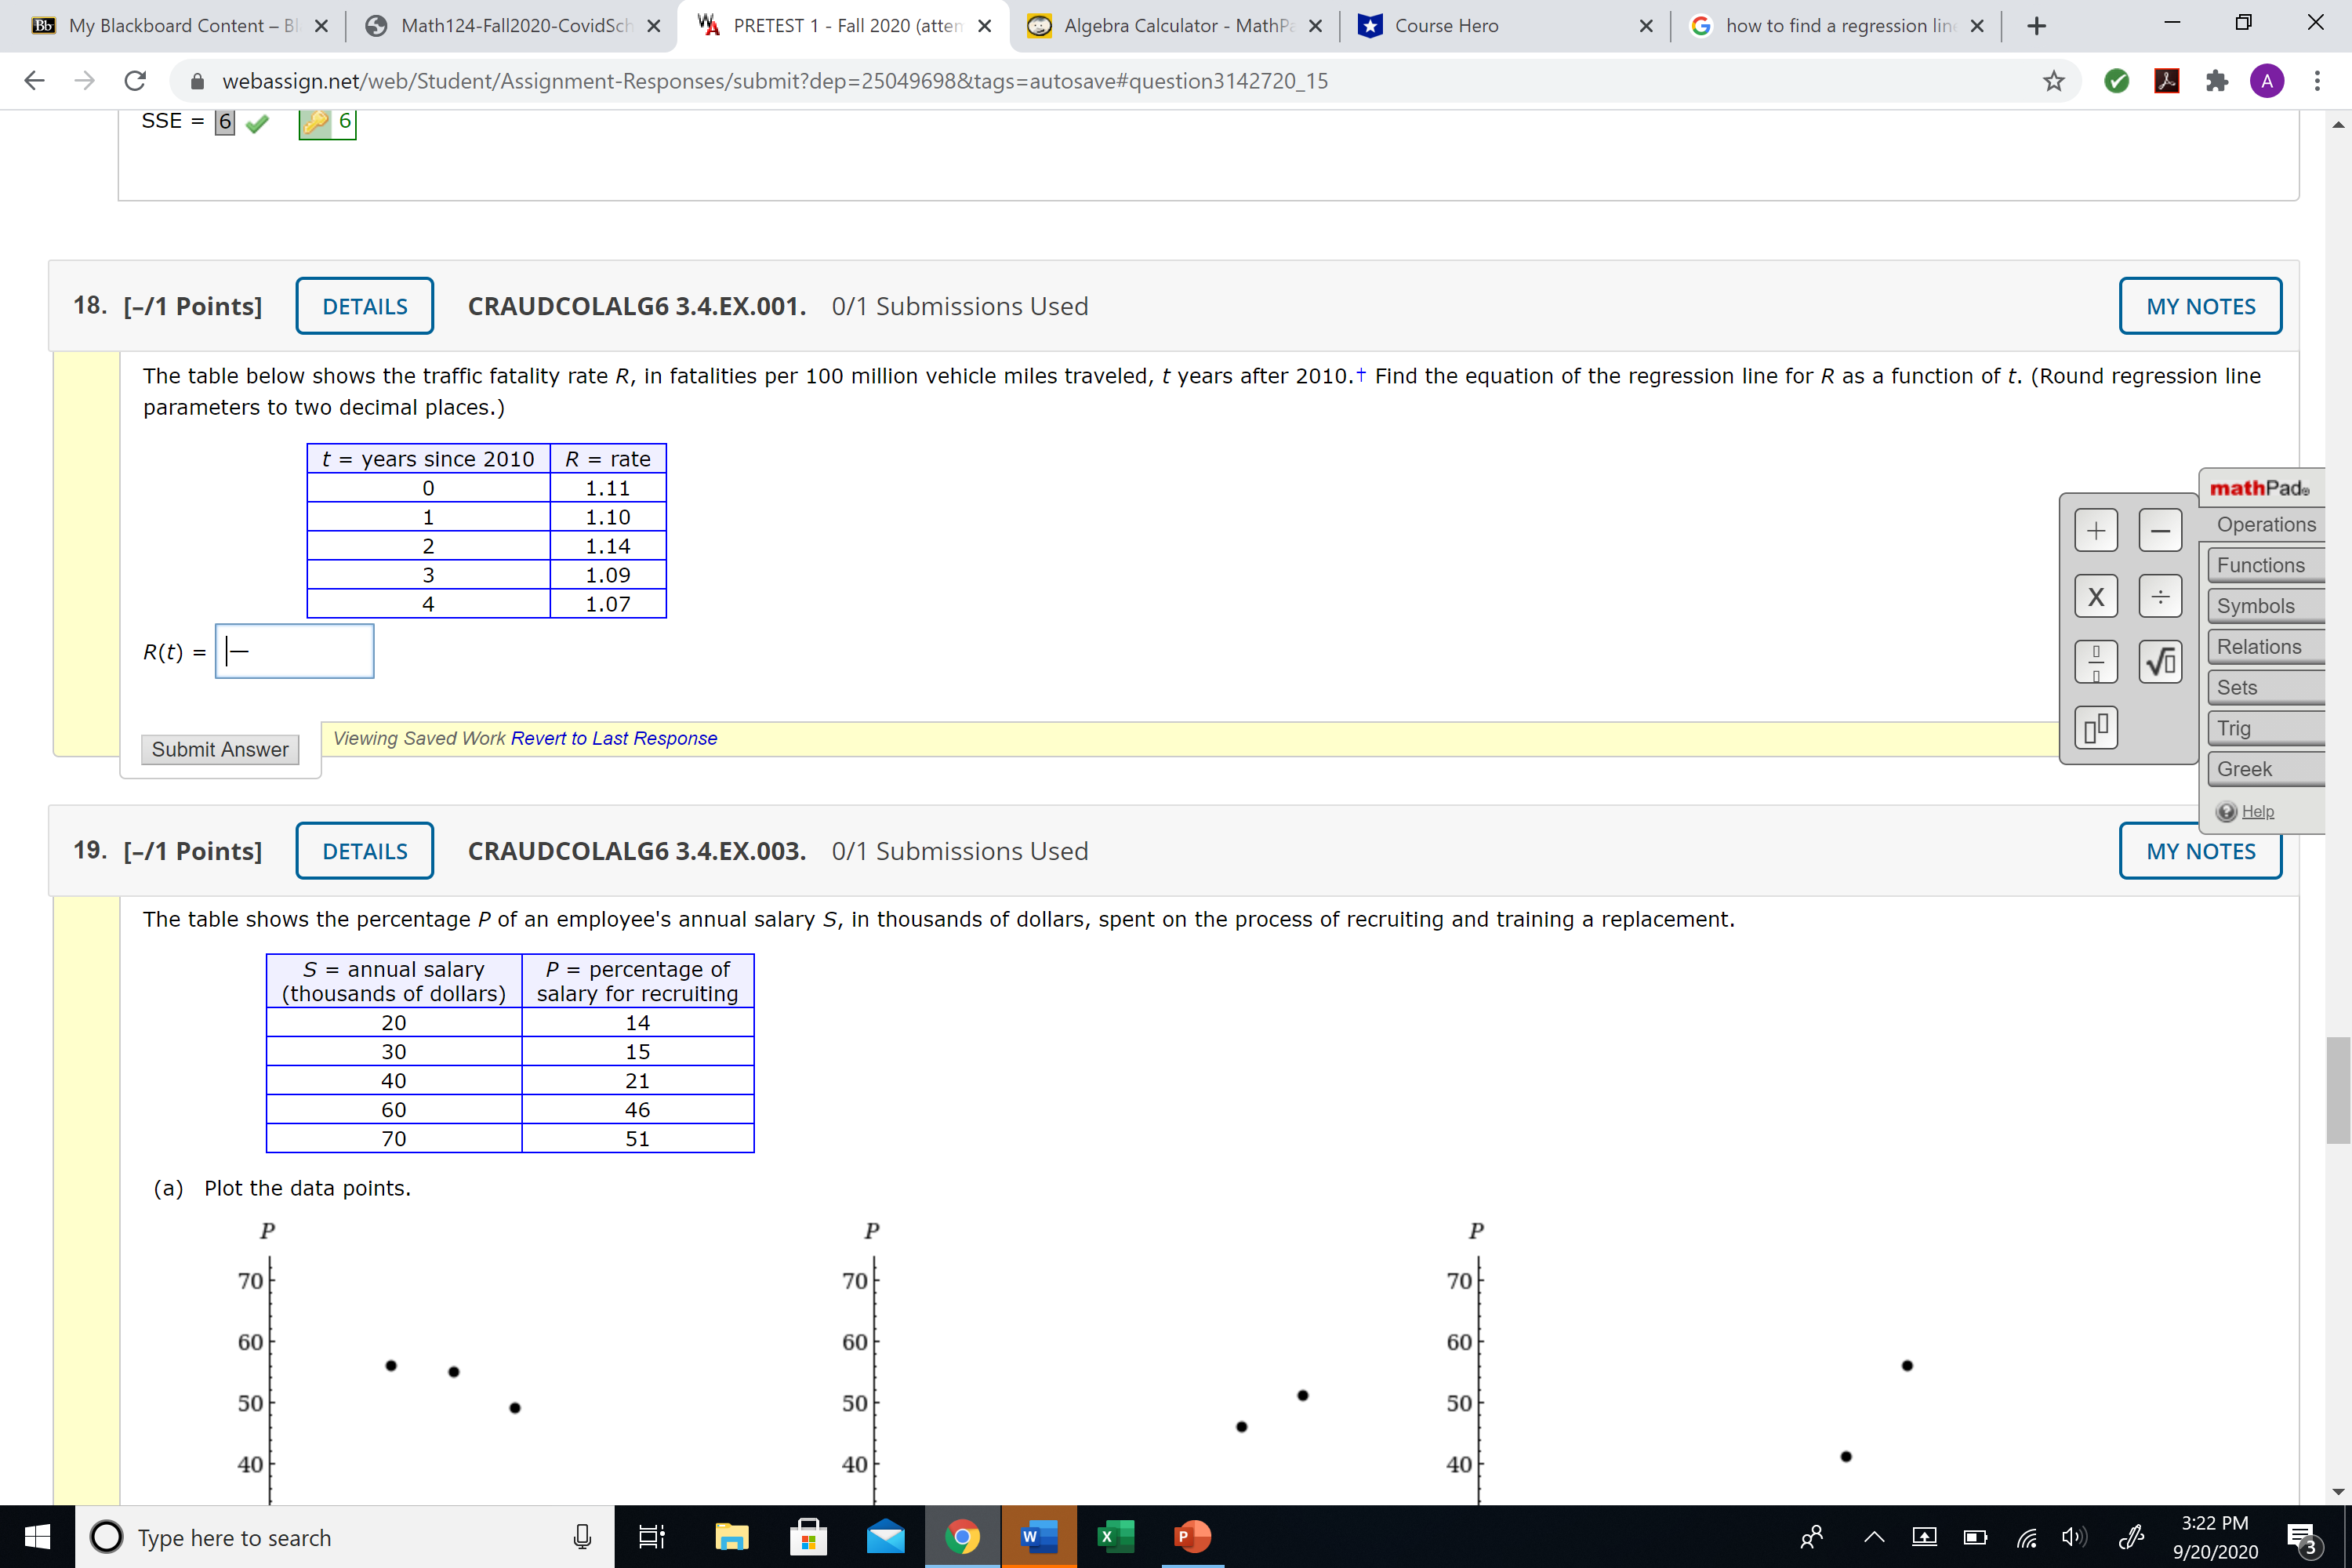
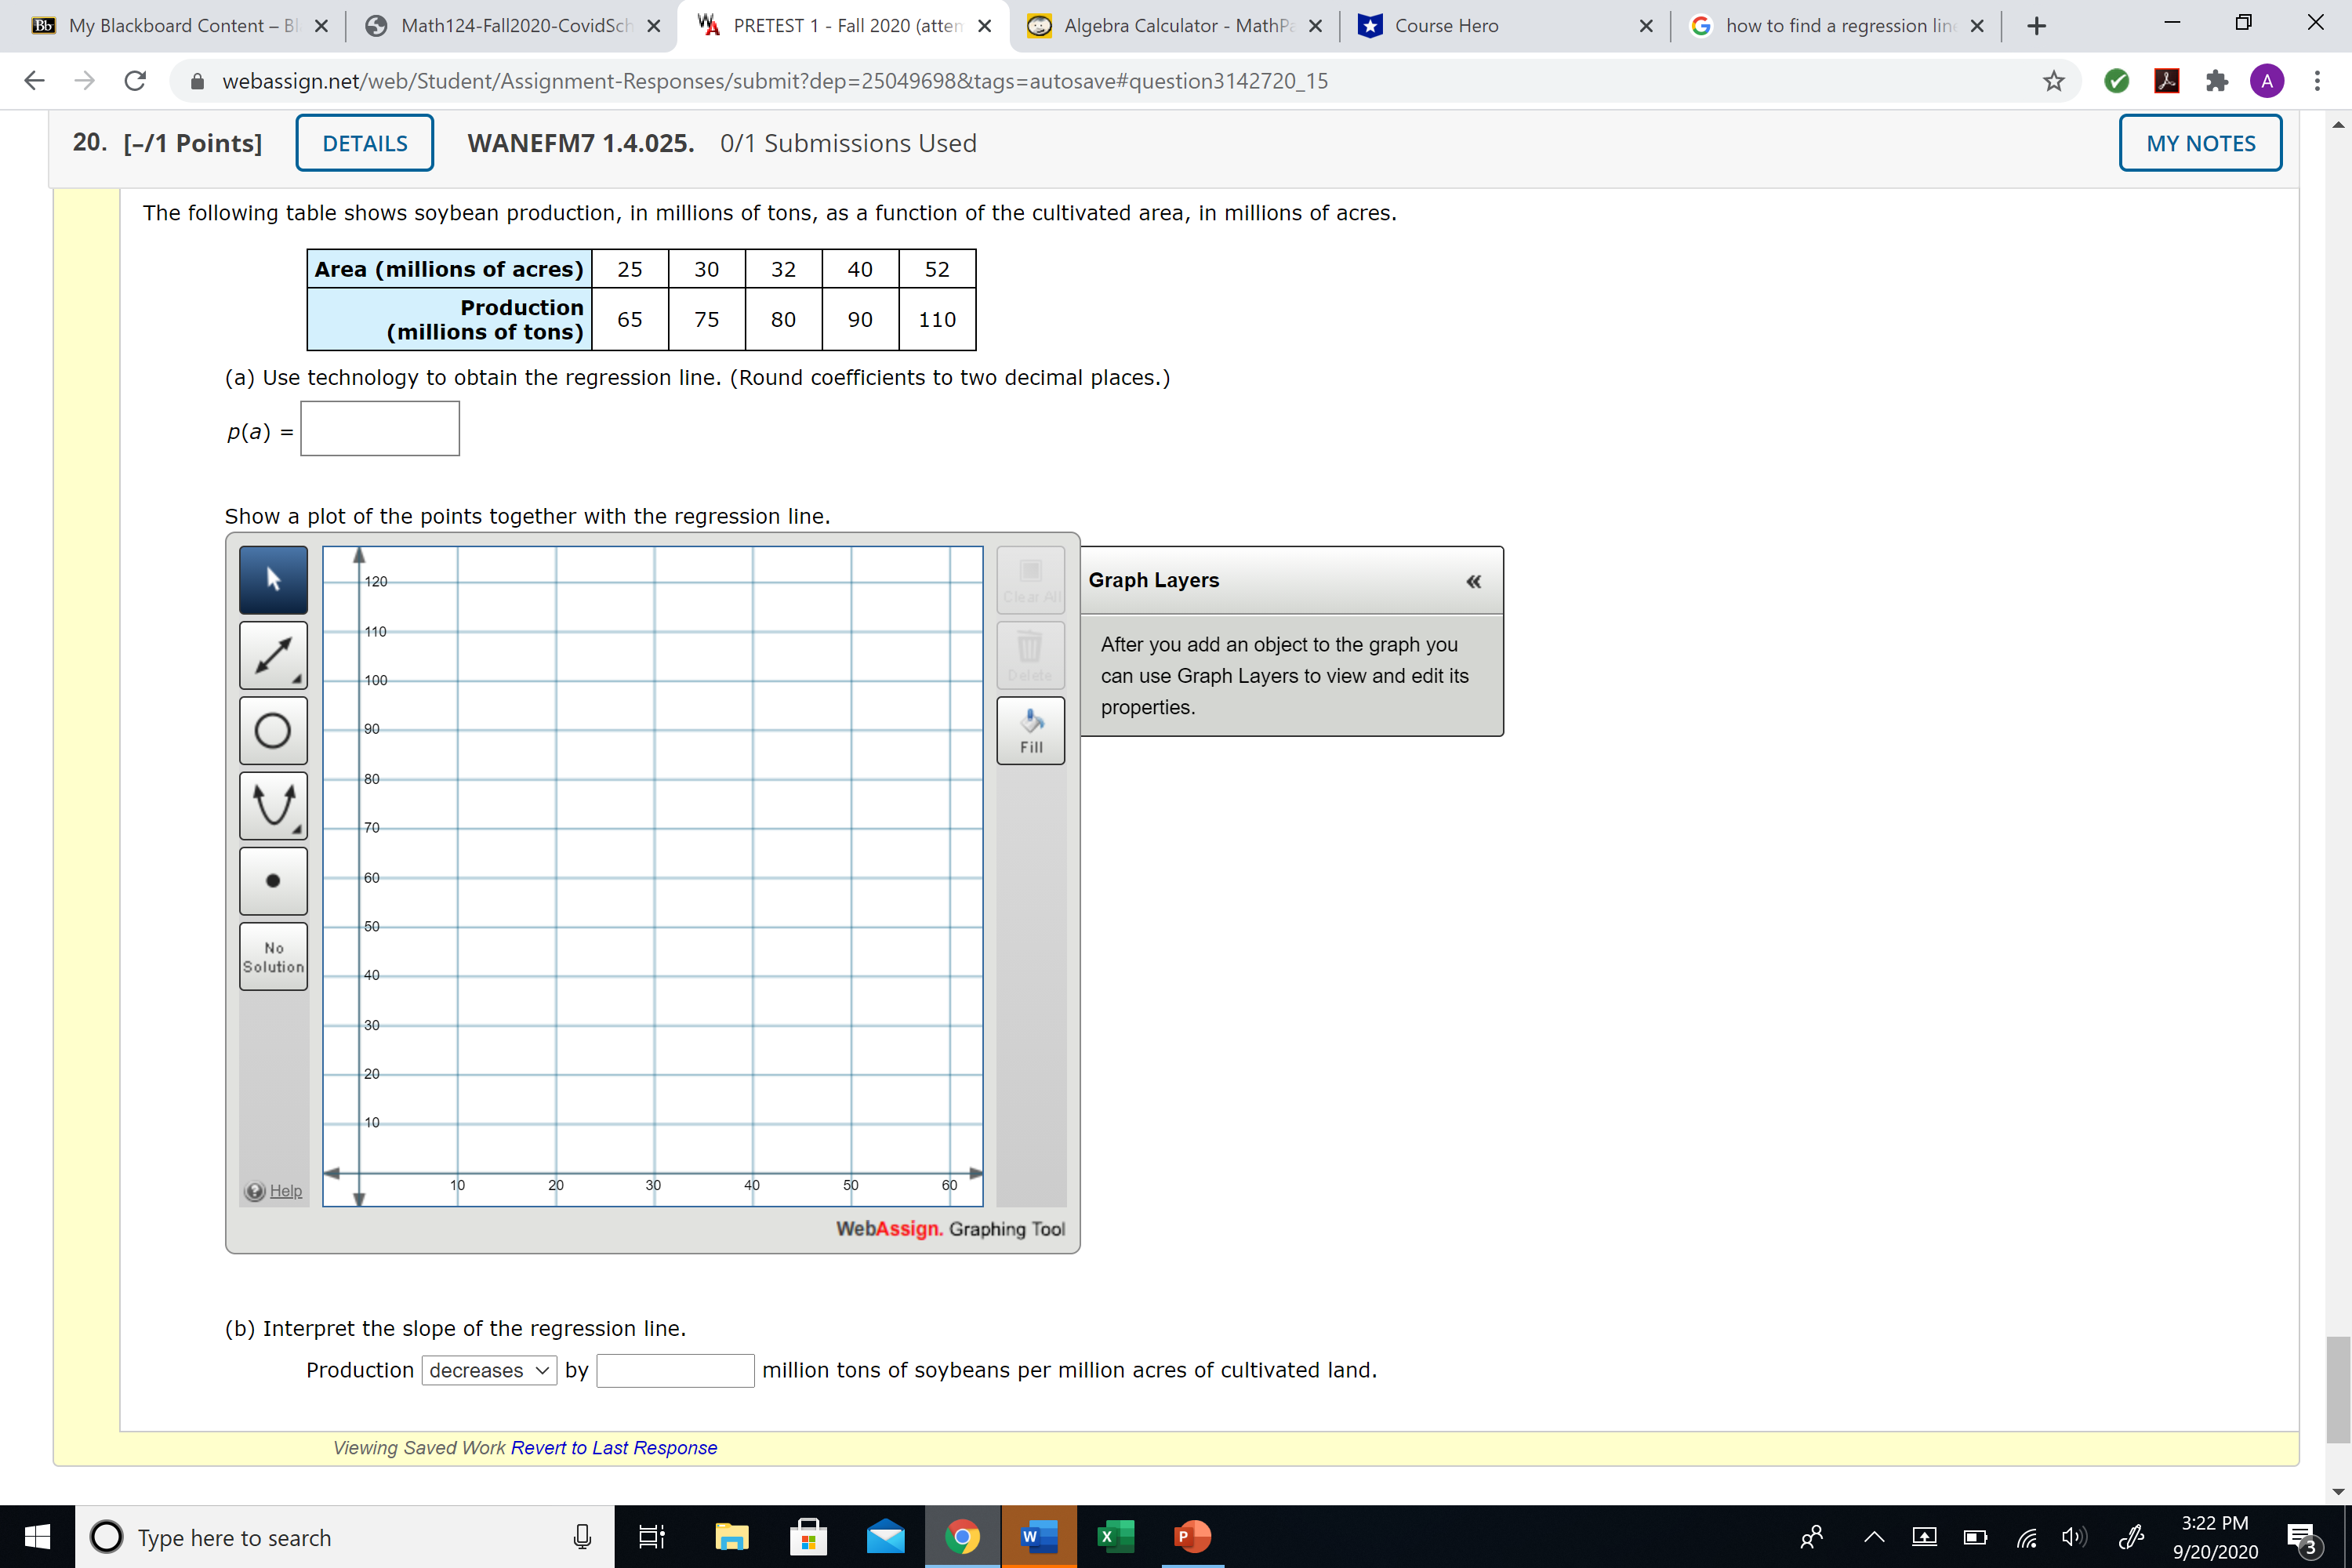
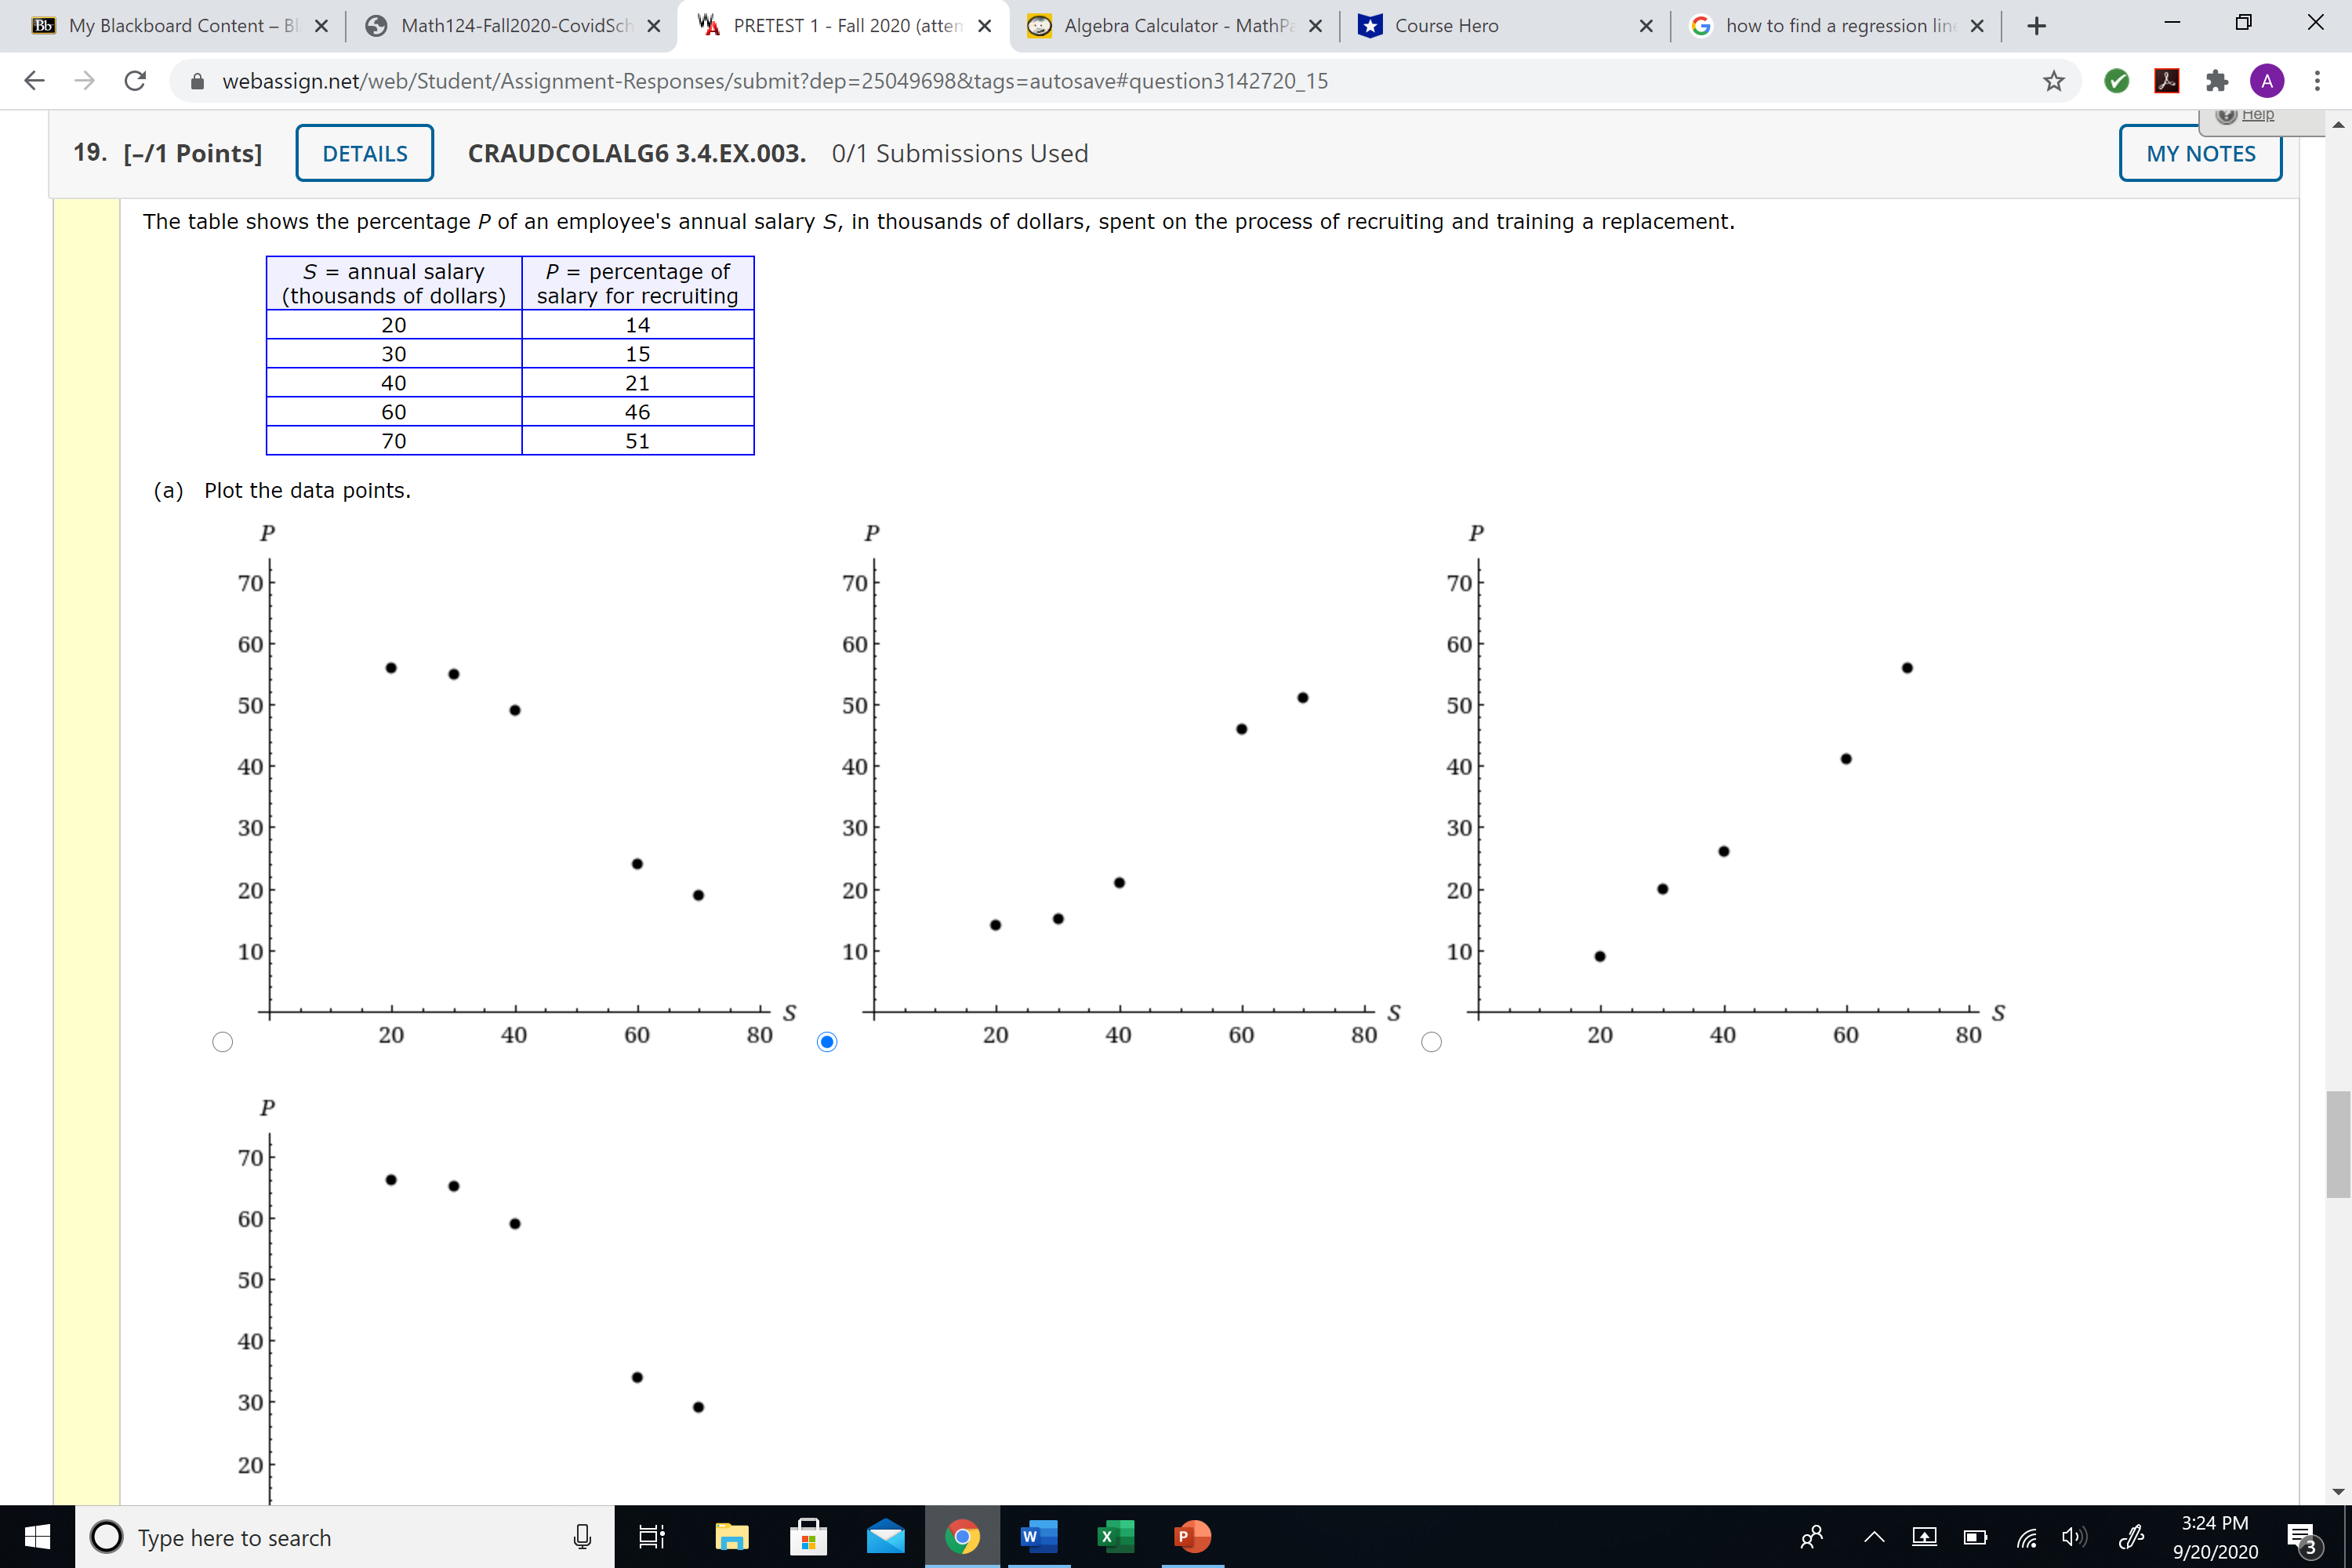
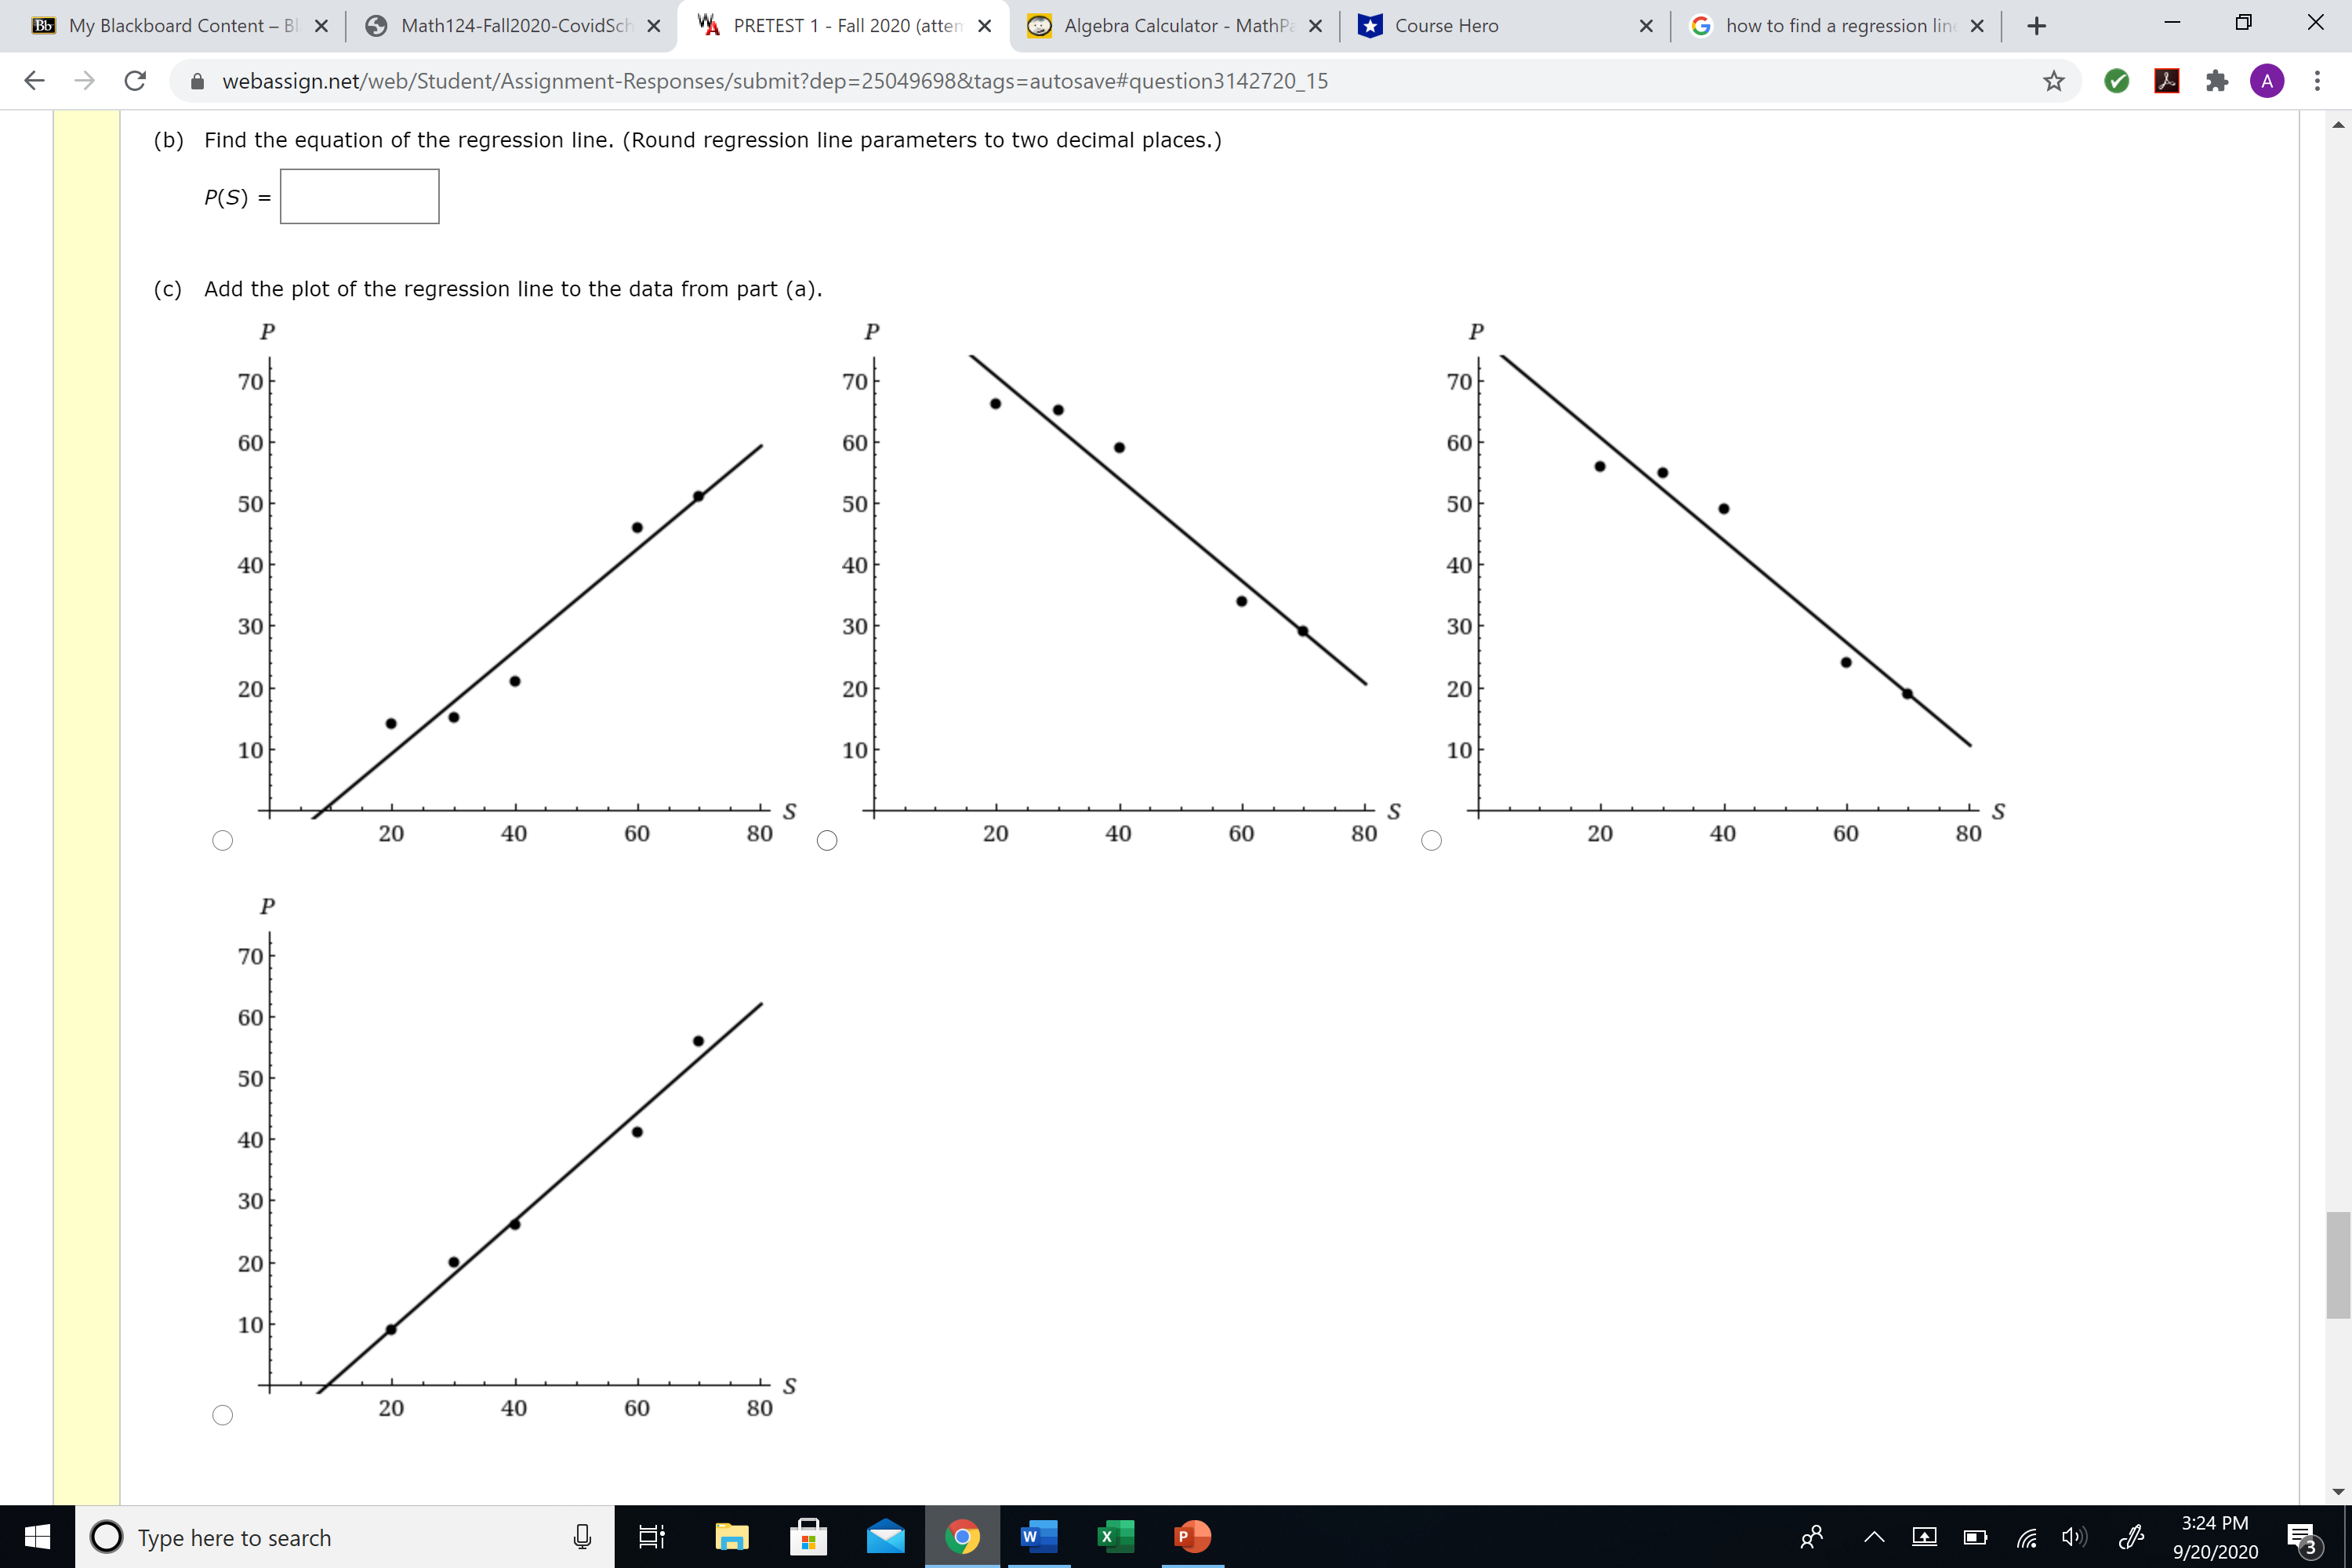
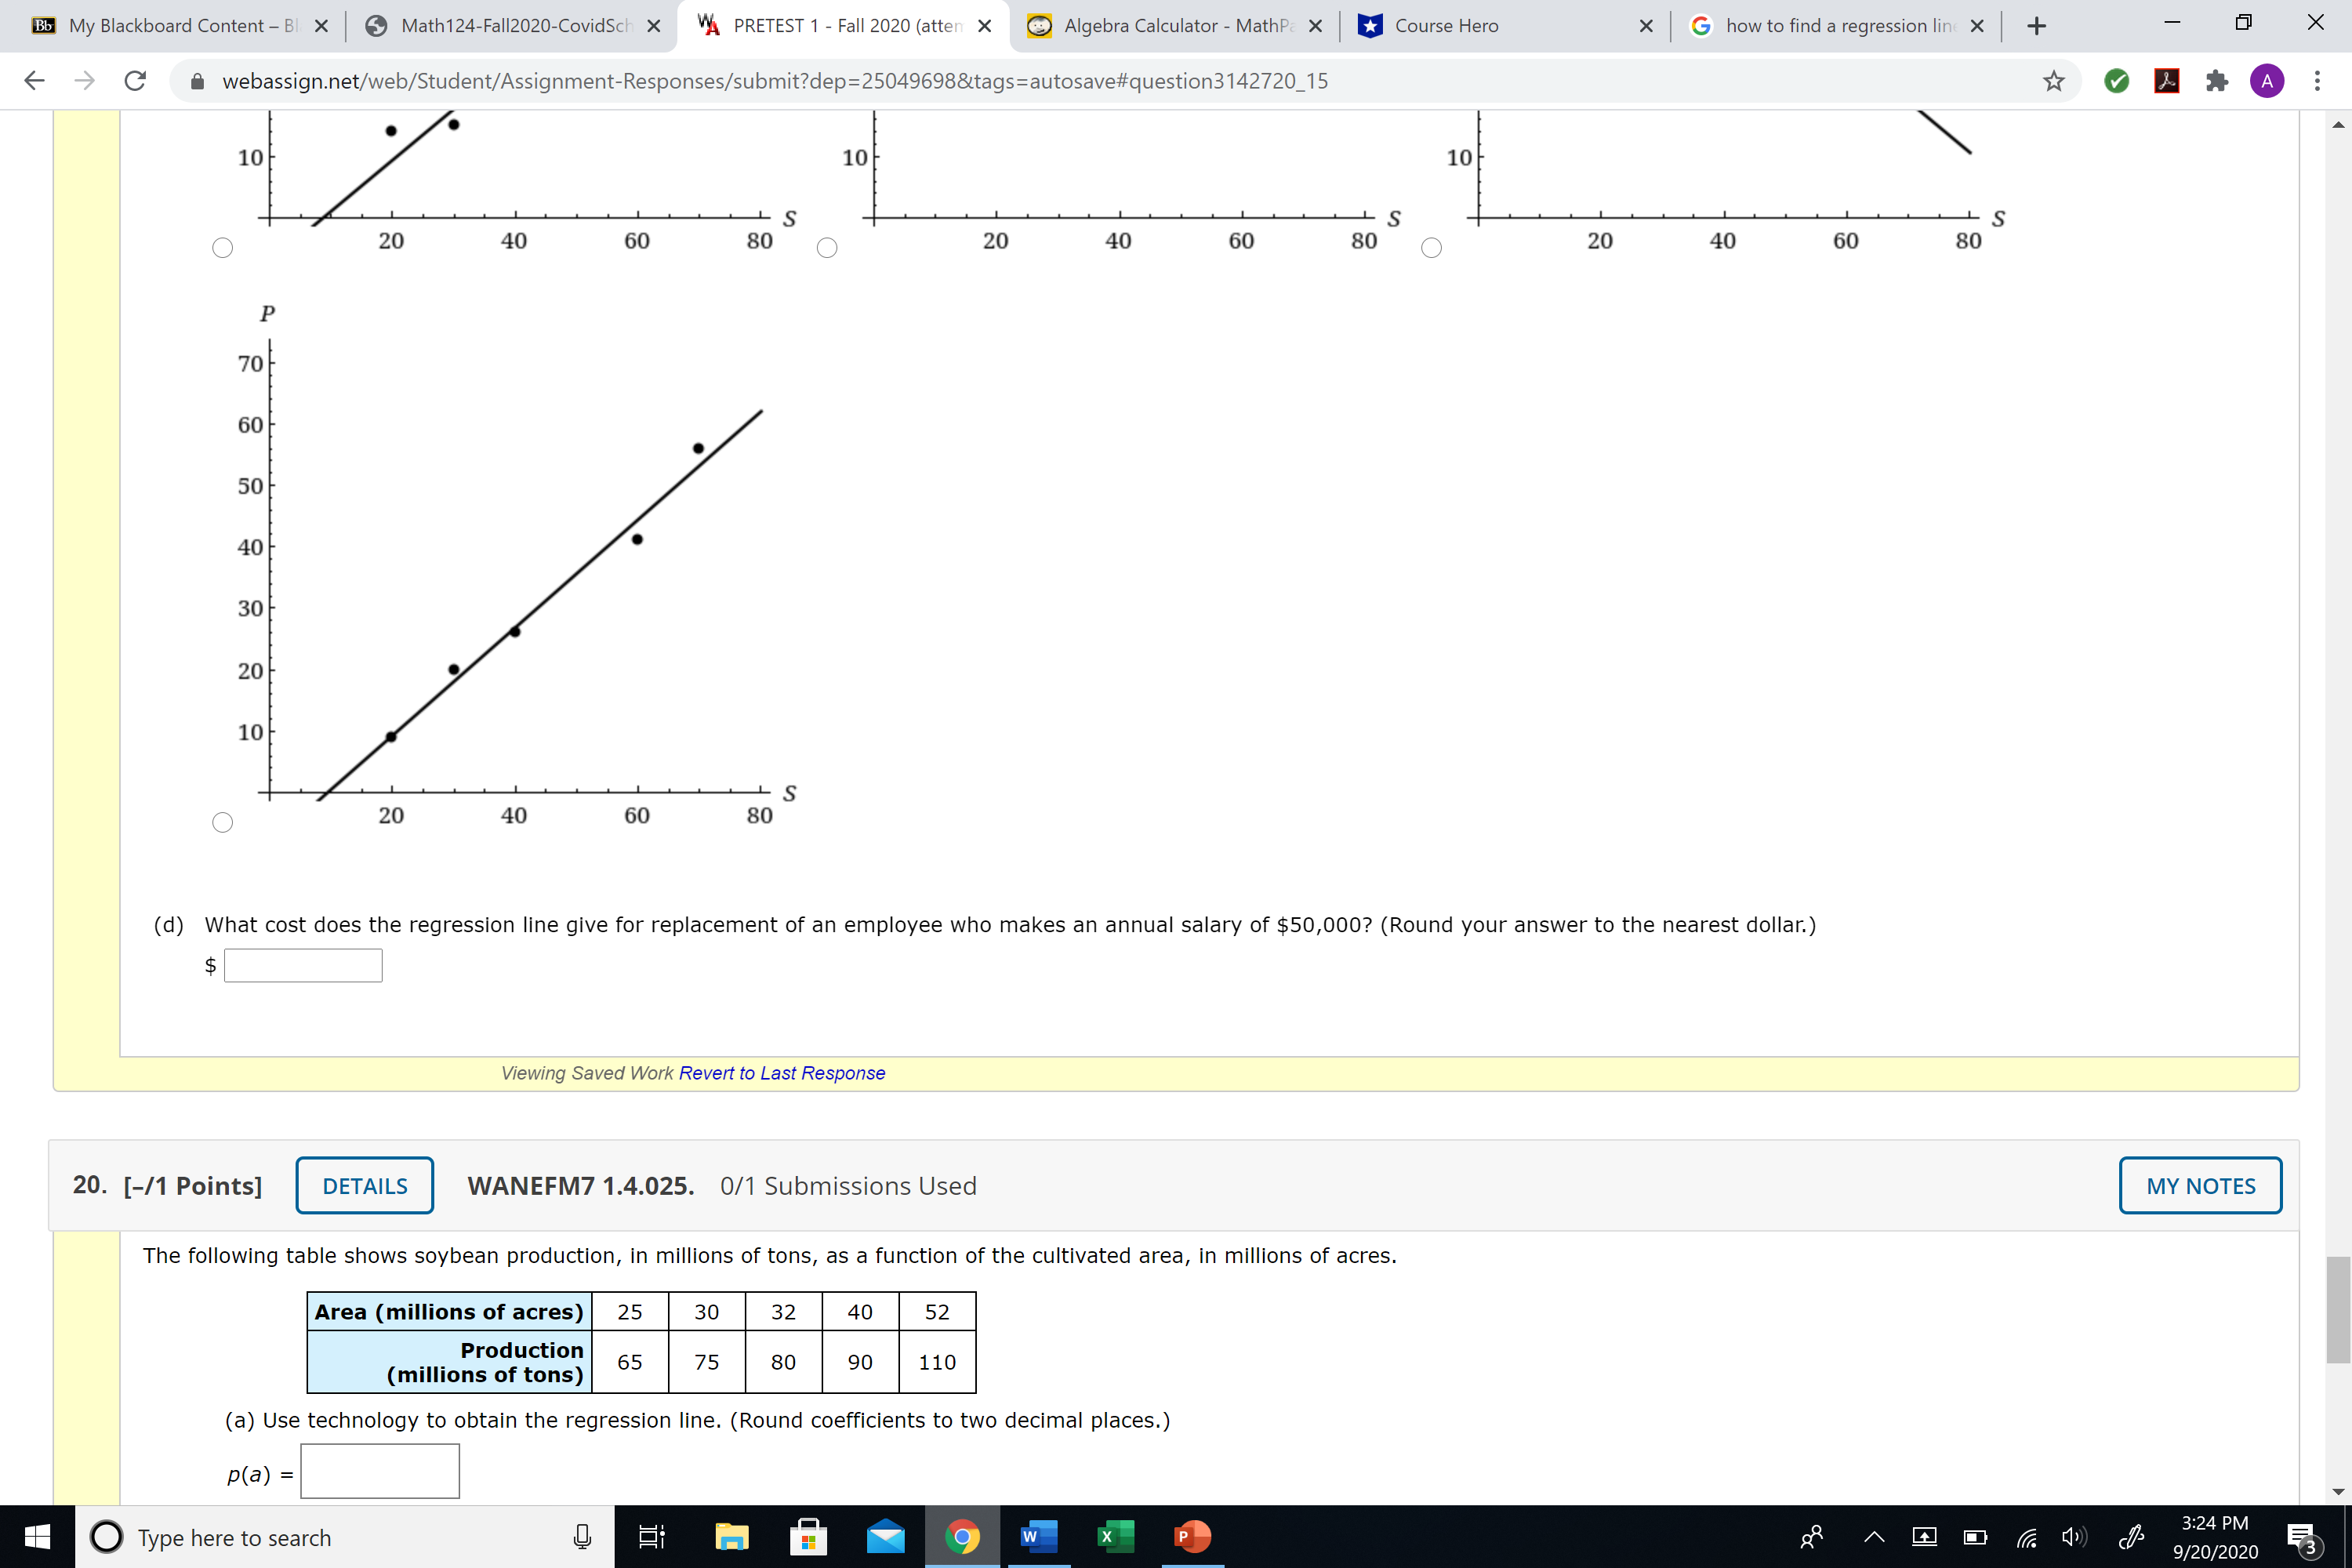
Bb My Blackboard Content - BI X Math124-Fall2020-CovidSch X VA PRETEST 1 - Fall 2020 (atten X Algebra Calculator - MathPc X Course Hero x G how to find a regression lint X + X C ^ webassign.net/web/Student/Assignment-Responses/submit?dep=25049698&tags=autosave#question3142720_15 SSE = 6 6 VIA A 18. [-/1 Points] DETAILS CRAUDCOLALG6 3.4.EX.001. 0/1 Submissions Used MY NOTES The table below shows the traffic fatality rate R, in fatalities per 100 million vehicle miles traveled, t years after 2010. + Find the equation of the regression line for R as a function of t. (Round regression line parameters to two decimal places.) t = years since 2010 | R = rate AWN + 1.11 1.10 mathPads 1.14 + Operations 1.09 Functions 1.07 X Symbols R (t ) = - Vi Relations Sets Submit Answer Viewing Saved Work Revert to Last Response Trig Greek Help 19. [-/1 Points] DETAILS CRAUDCOLALG6 3.4.EX.003. 0/1 Submissions Used MY NOTES The table shows the percentage P of an employee's annual salary S, in thousands of dollars, spent on the process of recruiting and training a replacement. al salary P = percentage of (thousands of dollars) salary for recruiting 20 14 30 15 40 21 60 46 70 51 (a) Plot the data points. P 70 70 70 60 60 60 50 50 50 40 40 40 O Type here to search M W x P 3:22 PM 9/20/2020 53Bb My Blackboard Content - BI X Math124-Fall2020-CovidSch X VA PRETEST 1 - Fall 2020 (atten X Algebra Calculator - MathPc X Course Hero x G how to find a regression lint X + X C webassign.net/web/Student/Assignment-Responses/submit?dep=25049698&tags=autosave#question3142720_15 VIAA 20. [-/1 Points] DETAILS WANEFM7 1.4.025. 0/1 Submissions Used MY NOTES The following table shows soybean production, in millions of tons, as a function of the cultivated area, in millions of acres. Area (millions of acres) | 25 30 32 40 52 Production (millions of tons) 65 75 80 110 (a) Use technology to obtain the regression line. (Round coefficients to two decimal places.) p(a) = Show a plot of the points together with the regression line. 120 Graph Layers 110 After you add an object to the graph you 100 can use Graph Layers to view and edit its 90 properties. Fill 80 70 . 60 50 No Solution 40 30 20 10 Help 10 20 30 40 50 60 WebAssign. Graphing Tool (b) Interpret the slope of the regression line. Production decreases v by million tons of soybeans per million acres of cultivated land. Viewing Saved Work Revert to Last Response Type here to search M w X P 3:22 PM 9/20/2020 53Bb My Blackboard Content - BI X Math124-Fall2020-CovidSch X VA PRETEST 1 - Fall 2020 (atten X Algebra Calculator - MathPc X Course Hero x G how to find a regression lint X + X C webassign.net/web/Student/Assignment-Responses/submit?dep=25049698&tags=autosave#question3142720_15 VIA A 19. [-/1 Points] DETAILS diaHA CRAUDCOLALG6 3.4.EX.003. 0/1 Submissions Used MY NOTES The table shows the percentage P of an employee's annual salary S, in thousands of dollars, spent on the process of recruiting and training a replacement. S = annual salary (thousands of dollars) P = percentage of salary for recruiting 20 14 30 15 40 21 60 46 70 51 (a) Plot the data points. P 70 70 70 60 60 60 50 50 50 40 40 40 30 30 30 20 20 20 10 10 10 S O 20 40 60 S 80 20 40 60 80 O 20 - S 40 60 80 70 60 50 40 30 20 O Type here to search 9 W X P 3:24 PM 9/20/2020 53Bb My Blackboard Content - BI X Math124-Fall2020-CovidSch x VA PRETEST 1 - Fall 2020 (atten X Algebra Calculator - MathPc X Course Hero x G how to find a regression lin( X + X C webassign.net/web/Student/Assignment-Responses/submit?dep=25049698&tags=autosave#question3142720_15 (b) Find the equation of the regression line. (Round regression line parameters to two decimal places.) P (S ) = (c) Add the plot of the regression line to the data from part (a). P 70 70 70 60 50 60 50 50 50 40 40 40 30 30 30 20 20 20 10 10 10 S 20 40 60 S 80 20 40 60 80 20 40 60 80 70 60 50 40 30 20 10 20 40 S O 60 80 O Type here to search M W X P 3:24 PM 9/20/2020 53Bb My Blackboard Content - BI X Math124-Fall2020-CovidSch X VA PRETEST 1 - Fall 2020 (atten X Algebra Calculator - MathPc X Course Hero x G how to find a regression lin( X + X C webassign.net/web/Student/Assignment-Responses/submit?dep=25049698&tags=autosave#question3142720_15 10 10 10 S S - S O 20 40 60 80 O 20 40 60 80 20 40 60 80 70 60 50 40 30 20 10 - S O 20 40 60 80 (d) What cost does the regression line give for replacement of an employee who makes an annual salary of $50,000? (Round your answer to the nearest dollar.) $ Viewing Saved Work Revert to Last Response 20. [-/1 Points] DETAILS WANEFM7 1.4.025. 0/1 Submissions Used MY NOTES The following table shows soybean production, in millions of tons, as a function of the cultivated area, in millions of acres. Area ( millions of acres) 25 30 32 40 52 Production (millions of tons) 65 75 80 90 110 (a) Use technology to obtain the regression line. (Round coefficients to two decimal places.) p(a) = O Type here to search U M w X P 3:24 PM 9/20/2020 F3
