

Question: I really need help with this python assignment please indent & double check This assignment has two parts and isn't nearly as formidable as it
I really need help with this python assignment
please indent & double check
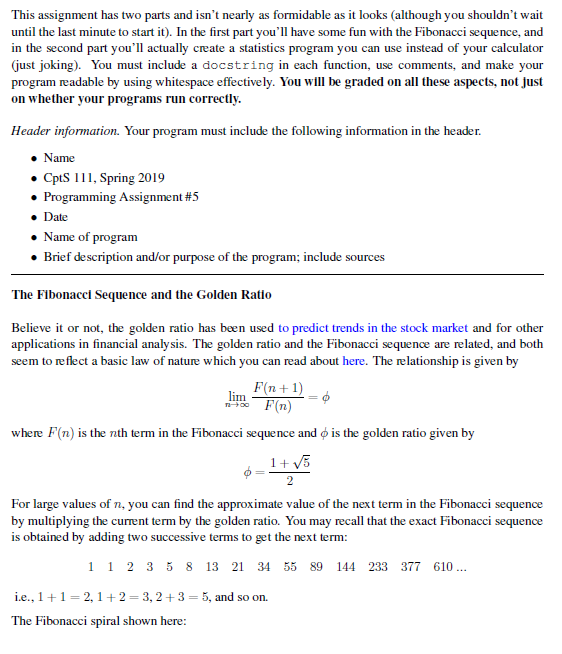
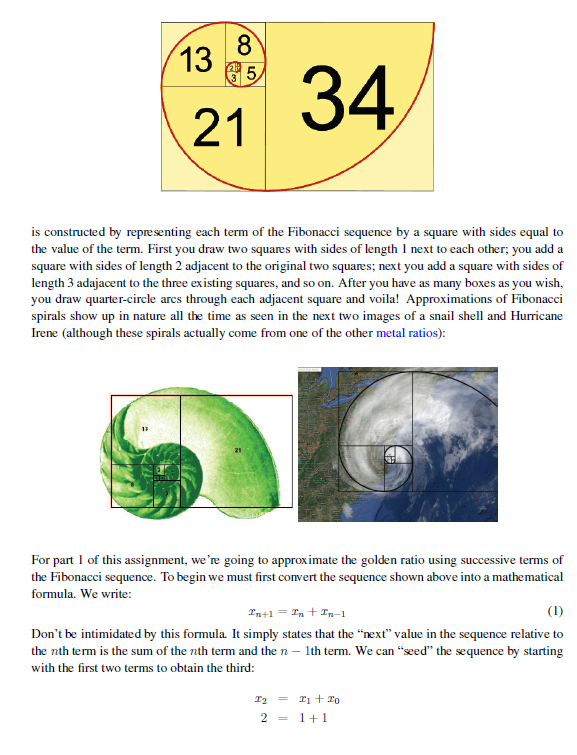
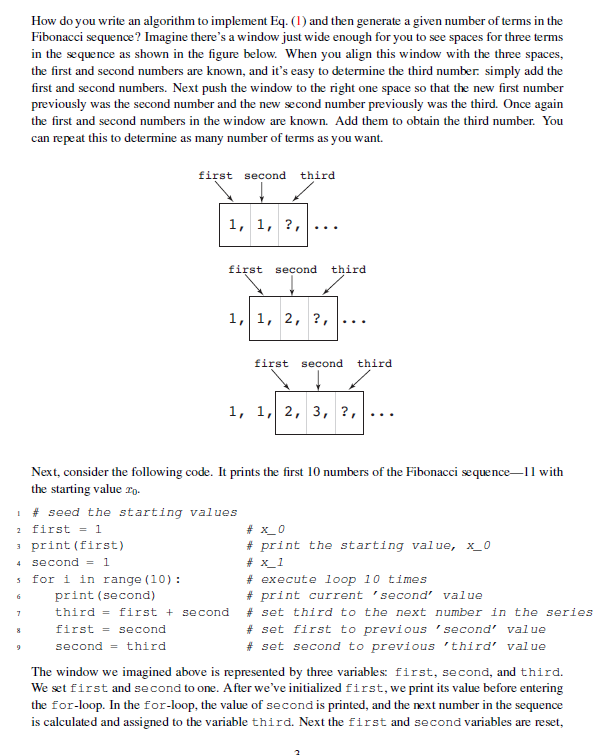
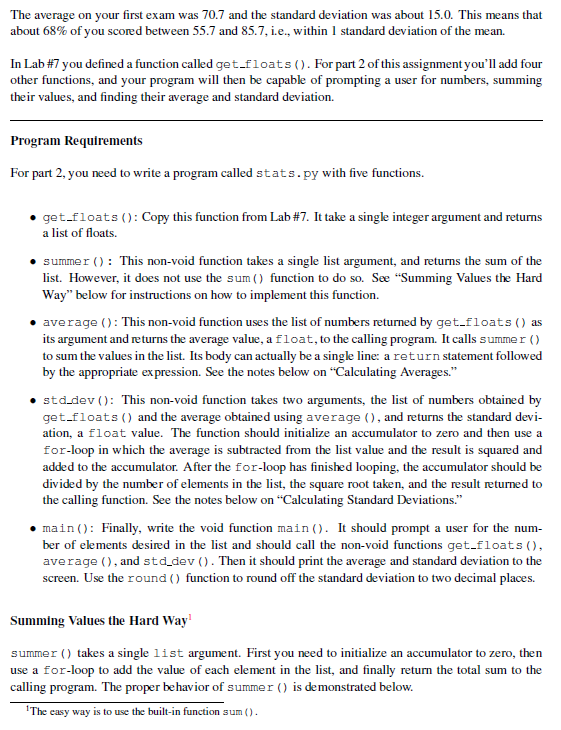
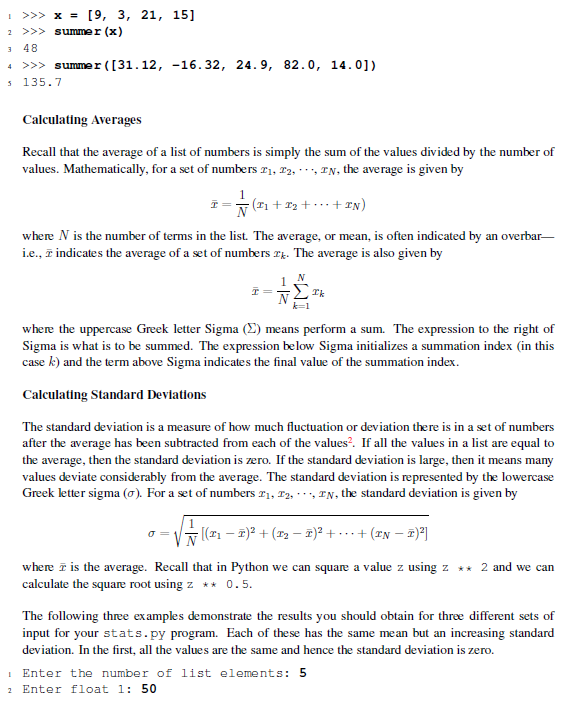
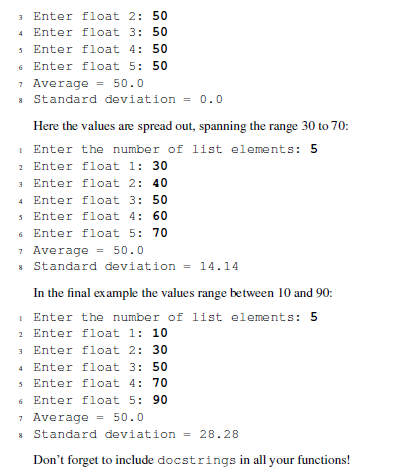
This assignment has two parts and isn't nearly as formidable as it looks (although you shouldn't wait until the last minute to start it). In the first part you'll have some fun with the Fibonacci sequence, and in the second part you'll actually create a statistics program you can use instead of your calculator just joking). You must include a docstring in each function, use comments, and make your program readable by using whitespace effectively. You will be graded on all these aspects, not just on whether your programs run correctly Header information. Your program must include the following information in the header. e Name . CptS 111, Spring 2019 Programming Assignment #5 Date Name of program e Brief description and/or purpose of the program; include sources The Flbonacci Sequence and the Golden Ratio Believe it or not, the golden ratio has been used to predict trends in the stock market and for other applications in financial analysis. The golden ratio and the Fibonacci sequence are related, and both seem to reflect a basic law of nature which you can read about here. The relationship is given by 1L 1L where F(n) is the nth term in the Fibonacci sequence and o is the golden ratio given by For large values of n, you can find the approximate value of the next term in the Fibonacci sequence by multiplying the current term by the golden ratio. You may recall that the exact Fibonacci sequence is obtained by adding two successive terms to get the next term 1 1 2 3 5 8 13 21 34 55 89 144 233 377 610 i.e., 11-2,12-3,2+3-5, and so on. The Fibonacci spiral shown here: 13 21 34 is constructed by representing each the value of the term. First you draw two squares with sides of length 1 next to each other; you add a square with sides of length 2 adjacent to the original two squares; next you add a square with sides of length 3 adajacent to the three existing squares, and so on. After you have as many boxes as you wish, you draw quarter-circle ares through each adjacent square and voila! Approximations of Fibonacci spirals show up in nature all the time as seen in the next two images of a snail Irene (although these spirals actually come from one of the other metal ratios): term of the Fibonacci i sequence by a square with sides equal to shell and Hurricane For part 1 of this assignment, we're going to approximate the golden ratio using successive terms of the Fibonacci sequence. To begin we must first convert the sequence shown above into a mathematical formula. We write Don't be intimidated by this formula It simply states that the "next" value in the sequence relative to the th term is the sum of the nth term and the n 1th term. We can "seed" the sequence by starting with the first two terms to obtain the third: 211 How do you write an algorithm to implement Eq. () and then generate a given number of terms in the Fibonacci sequence? Imagine there's a window just wide enough for you to see spaces for three terms in the sequence as shown in the fi the first and second numbers are known, and it's easy to determine the third number simply add the first and second numbers. Next push the window to the previously was the second number and the new second number previously was the third. Once again the first and second numbers in the window are known. Add them to obtain the third number.You can repeat this to determine as many number of terms as you want. gure below. When you align this window with the three spaces, right one space so that the new first number first second third first second third first second third Next, consider the following code. It prints the first 10 numbers of the Fibonacci sequence-11 with the starting value ro. seed the starting values 2 first 1 print (first) 4 Second1 # print the starting value, x-0 #s_1 # execute loop 10 times # print current ,second, value for i in range (10): print (second) third = first + second # set third to the next number in the series first -second second-third # set first to previous ,second, value # set second to previous , third, Value The window we imagined above is represented by three variables: first, second, and third. We set first and second to one. After we've initialized first, we print its value before entering the for-loop. In the for-loop, the value of second is printed, and the next number in the sequence is calculated and assigned to the variable third. Next the first and second variables are reset, The average on your first exam was about 68% of you scored between 55.7 and 85.7, ie., within 1 standard deviation of the mean. 70.7 and the standard deviation was about 15.0. This means that In Lab #7 you defined a function called get-floats ( ) . For part 2 of this assignment you'll add four other functions, and your program will then be capable of prompting a user for numbers, summing their values, and finding their average and standard deviation. Program Requirements For part 2, you need to write a program called stats.py with five functions. get-floats ( ) : Copy this function from Lab #7. It take a single integer argument and returns a list of floats. . summer This non-void function takes a single list argument, and returns the sum of the list. However, it does not use the sum) function to do so. See "Summing Values the Hard Way" below for instructions on how to implement this function. average ): This non-void function uses the list of numbers returned by get.floats ) as its argument and returns the average value, afloat, to the calling program. It calls summer () to sum the values in the list. Its body can actually be a single line: a return statement followed by the appropriate ex pression. See the notes below on "Calculating Averages. * std.dev (): This non-void function takes two arguments, the list of numbers obtained by get.floats) and the average obtained using average (), and returns the standard devi- ation, a float value. The function should initialize an accumulator to zero and then use a for-loop in which the average is subtracted from the list value and the result is squared and added to the accumulator. After the for-loop has finished looping, the accumulator should be divided by the number of elements in the list, the square root taken, and the result returned to the calling function. See the notes below on "Calculating Standard Deviations." * main): Finally, write the void function main . It should prompt a user for the num- ber of elements desired in the list and should call the non-void functions get.floats () average, and stddev). Then it should print the average and standard deviation to the screen. Use the round() function to round off the standard deviation to two decimal places. Summing Values the Hard Way summer takes a single list argument. First you need to initialize an accumulator to zero, then use a for-loop to add the value of each element in the list, and finally return the total sum to the calling program. The proper behavior of summer ) is demonstrated below. The easy way is to use the built-in functium ) [9, 3, 21, 15] 2 >>> summe r (x) 3 48 4 summer ([31.12, -16. 32, 24.9, 82.0, 14.0]) 5 135.7 Calculating Averages Recall that the average of a list of numbers is simply the sum of the values divided by the number of values. Mathematically, for a set of numbers zi. T2. -. TN, the average is given by where N is the number of terms in the list. The average, or mean, is often indicated by an overbar i.e., indicates the average of a set of numbers k. The average is also given by where the uppercase Greek letter Sigma (2) means perform a sum. The expression to the right of Sigma is what is to be summed. The expression below Sigma initializes a summation index (in this case k) and the term above Sigma indicates the final value of the summation index. Calculating Standard Deviations The standard deviation is a measure of how much fluctuation or deviation there is in a set of numbers after the average has been subtracted from each of the values2. If all the values in a list are equal to the average, then the standard deviation is zero. If the standard deviation is large, then it means many values deviate considerably from the average. The standard deviation is represented by the lowercase Greek letter sigma (o). For a set of numbers ri, r2, . . ., rN, the standard deviation is given by where r is the average. Recall that in Python we can square a value z using z *2 and we can calculate the square root using z*O.5 The following three examples demonstrate the results you should obtain for three different sets of input for your stats.py program. Each of these has the same mean but an increasing standard deviation. In the first, all the values are the same and hence the standard deviation is zero. Enter the number of list elements: 5 2 Enter float 1: 50 a Enter float 2: 50 4 Enter float 3: 50 s Enter float 4: 50 6 Enter float 5: 50 Average-50.0 s Standard deviation0.0 Here the values are spread out, spanning the range 30 to 70: Enter the number of list elements: 5 2 Enter float 1: 30 a Enter float 2: 40 4 Enter float 3: 50 s Enter float 4: 60 6 Enter float 5: 70 7 Ave rage = 50.0 s Standard deviation14.14 In the final example the values range between 10 and 90: Enter the number of list elements: 5 Enter float 1: 10 a Enter float 2: 30 4 Enter float 3: 50 s Enter float 4: 70 6 Enter float 5: 90 Average-50.0 s Standard deviation28.28 Don't forget to include docstrings in all your functions! This assignment has two parts and isn't nearly as formidable as it looks (although you shouldn't wait until the last minute to start it). In the first part you'll have some fun with the Fibonacci sequence, and in the second part you'll actually create a statistics program you can use instead of your calculator just joking). You must include a docstring in each function, use comments, and make your program readable by using whitespace effectively. You will be graded on all these aspects, not just on whether your programs run correctly Header information. Your program must include the following information in the header. e Name . CptS 111, Spring 2019 Programming Assignment #5 Date Name of program e Brief description and/or purpose of the program; include sources The Flbonacci Sequence and the Golden Ratio Believe it or not, the golden ratio has been used to predict trends in the stock market and for other applications in financial analysis. The golden ratio and the Fibonacci sequence are related, and both seem to reflect a basic law of nature which you can read about here. The relationship is given by 1L 1L where F(n) is the nth term in the Fibonacci sequence and o is the golden ratio given by For large values of n, you can find the approximate value of the next term in the Fibonacci sequence by multiplying the current term by the golden ratio. You may recall that the exact Fibonacci sequence is obtained by adding two successive terms to get the next term 1 1 2 3 5 8 13 21 34 55 89 144 233 377 610 i.e., 11-2,12-3,2+3-5, and so on. The Fibonacci spiral shown here: 13 21 34 is constructed by representing each the value of the term. First you draw two squares with sides of length 1 next to each other; you add a square with sides of length 2 adjacent to the original two squares; next you add a square with sides of length 3 adajacent to the three existing squares, and so on. After you have as many boxes as you wish, you draw quarter-circle ares through each adjacent square and voila! Approximations of Fibonacci spirals show up in nature all the time as seen in the next two images of a snail Irene (although these spirals actually come from one of the other metal ratios): term of the Fibonacci i sequence by a square with sides equal to shell and Hurricane For part 1 of this assignment, we're going to approximate the golden ratio using successive terms of the Fibonacci sequence. To begin we must first convert the sequence shown above into a mathematical formula. We write Don't be intimidated by this formula It simply states that the "next" value in the sequence relative to the th term is the sum of the nth term and the n 1th term. We can "seed" the sequence by starting with the first two terms to obtain the third: 211 How do you write an algorithm to implement Eq. () and then generate a given number of terms in the Fibonacci sequence? Imagine there's a window just wide enough for you to see spaces for three terms in the sequence as shown in the fi the first and second numbers are known, and it's easy to determine the third number simply add the first and second numbers. Next push the window to the previously was the second number and the new second number previously was the third. Once again the first and second numbers in the window are known. Add them to obtain the third number.You can repeat this to determine as many number of terms as you want. gure below. When you align this window with the three spaces, right one space so that the new first number first second third first second third first second third Next, consider the following code. It prints the first 10 numbers of the Fibonacci sequence-11 with the starting value ro. seed the starting values 2 first 1 print (first) 4 Second1 # print the starting value, x-0 #s_1 # execute loop 10 times # print current ,second, value for i in range (10): print (second) third = first + second # set third to the next number in the series first -second second-third # set first to previous ,second, value # set second to previous , third, Value The window we imagined above is represented by three variables: first, second, and third. We set first and second to one. After we've initialized first, we print its value before entering the for-loop. In the for-loop, the value of second is printed, and the next number in the sequence is calculated and assigned to the variable third. Next the first and second variables are reset, The average on your first exam was about 68% of you scored between 55.7 and 85.7, ie., within 1 standard deviation of the mean. 70.7 and the standard deviation was about 15.0. This means that In Lab #7 you defined a function called get-floats ( ) . For part 2 of this assignment you'll add four other functions, and your program will then be capable of prompting a user for numbers, summing their values, and finding their average and standard deviation. Program Requirements For part 2, you need to write a program called stats.py with five functions. get-floats ( ) : Copy this function from Lab #7. It take a single integer argument and returns a list of floats. . summer This non-void function takes a single list argument, and returns the sum of the list. However, it does not use the sum) function to do so. See "Summing Values the Hard Way" below for instructions on how to implement this function. average ): This non-void function uses the list of numbers returned by get.floats ) as its argument and returns the average value, afloat, to the calling program. It calls summer () to sum the values in the list. Its body can actually be a single line: a return statement followed by the appropriate ex pression. See the notes below on "Calculating Averages. * std.dev (): This non-void function takes two arguments, the list of numbers obtained by get.floats) and the average obtained using average (), and returns the standard devi- ation, a float value. The function should initialize an accumulator to zero and then use a for-loop in which the average is subtracted from the list value and the result is squared and added to the accumulator. After the for-loop has finished looping, the accumulator should be divided by the number of elements in the list, the square root taken, and the result returned to the calling function. See the notes below on "Calculating Standard Deviations." * main): Finally, write the void function main . It should prompt a user for the num- ber of elements desired in the list and should call the non-void functions get.floats () average, and stddev). Then it should print the average and standard deviation to the screen. Use the round() function to round off the standard deviation to two decimal places. Summing Values the Hard Way summer takes a single list argument. First you need to initialize an accumulator to zero, then use a for-loop to add the value of each element in the list, and finally return the total sum to the calling program. The proper behavior of summer ) is demonstrated below. The easy way is to use the built-in functium ) [9, 3, 21, 15] 2 >>> summe r (x) 3 48 4 summer ([31.12, -16. 32, 24.9, 82.0, 14.0]) 5 135.7 Calculating Averages Recall that the average of a list of numbers is simply the sum of the values divided by the number of values. Mathematically, for a set of numbers zi. T2. -. TN, the average is given by where N is the number of terms in the list. The average, or mean, is often indicated by an overbar i.e., indicates the average of a set of numbers k. The average is also given by where the uppercase Greek letter Sigma (2) means perform a sum. The expression to the right of Sigma is what is to be summed. The expression below Sigma initializes a summation index (in this case k) and the term above Sigma indicates the final value of the summation index. Calculating Standard Deviations The standard deviation is a measure of how much fluctuation or deviation there is in a set of numbers after the average has been subtracted from each of the values2. If all the values in a list are equal to the average, then the standard deviation is zero. If the standard deviation is large, then it means many values deviate considerably from the average. The standard deviation is represented by the lowercase Greek letter sigma (o). For a set of numbers ri, r2, . . ., rN, the standard deviation is given by where r is the average. Recall that in Python we can square a value z using z *2 and we can calculate the square root using z*O.5 The following three examples demonstrate the results you should obtain for three different sets of input for your stats.py program. Each of these has the same mean but an increasing standard deviation. In the first, all the values are the same and hence the standard deviation is zero. Enter the number of list elements: 5 2 Enter float 1: 50 a Enter float 2: 50 4 Enter float 3: 50 s Enter float 4: 50 6 Enter float 5: 50 Average-50.0 s Standard deviation0.0 Here the values are spread out, spanning the range 30 to 70: Enter the number of list elements: 5 2 Enter float 1: 30 a Enter float 2: 40 4 Enter float 3: 50 s Enter float 4: 60 6 Enter float 5: 70 7 Ave rage = 50.0 s Standard deviation14.14 In the final example the values range between 10 and 90: Enter the number of list elements: 5 Enter float 1: 10 a Enter float 2: 30 4 Enter float 3: 50 s Enter float 4: 70 6 Enter float 5: 90 Average-50.0 s Standard deviation28.28 Don't forget to include docstrings in all your functions
Step by Step Solution
There are 3 Steps involved in it

Get step-by-step solutions from verified subject matter experts