I require assistance
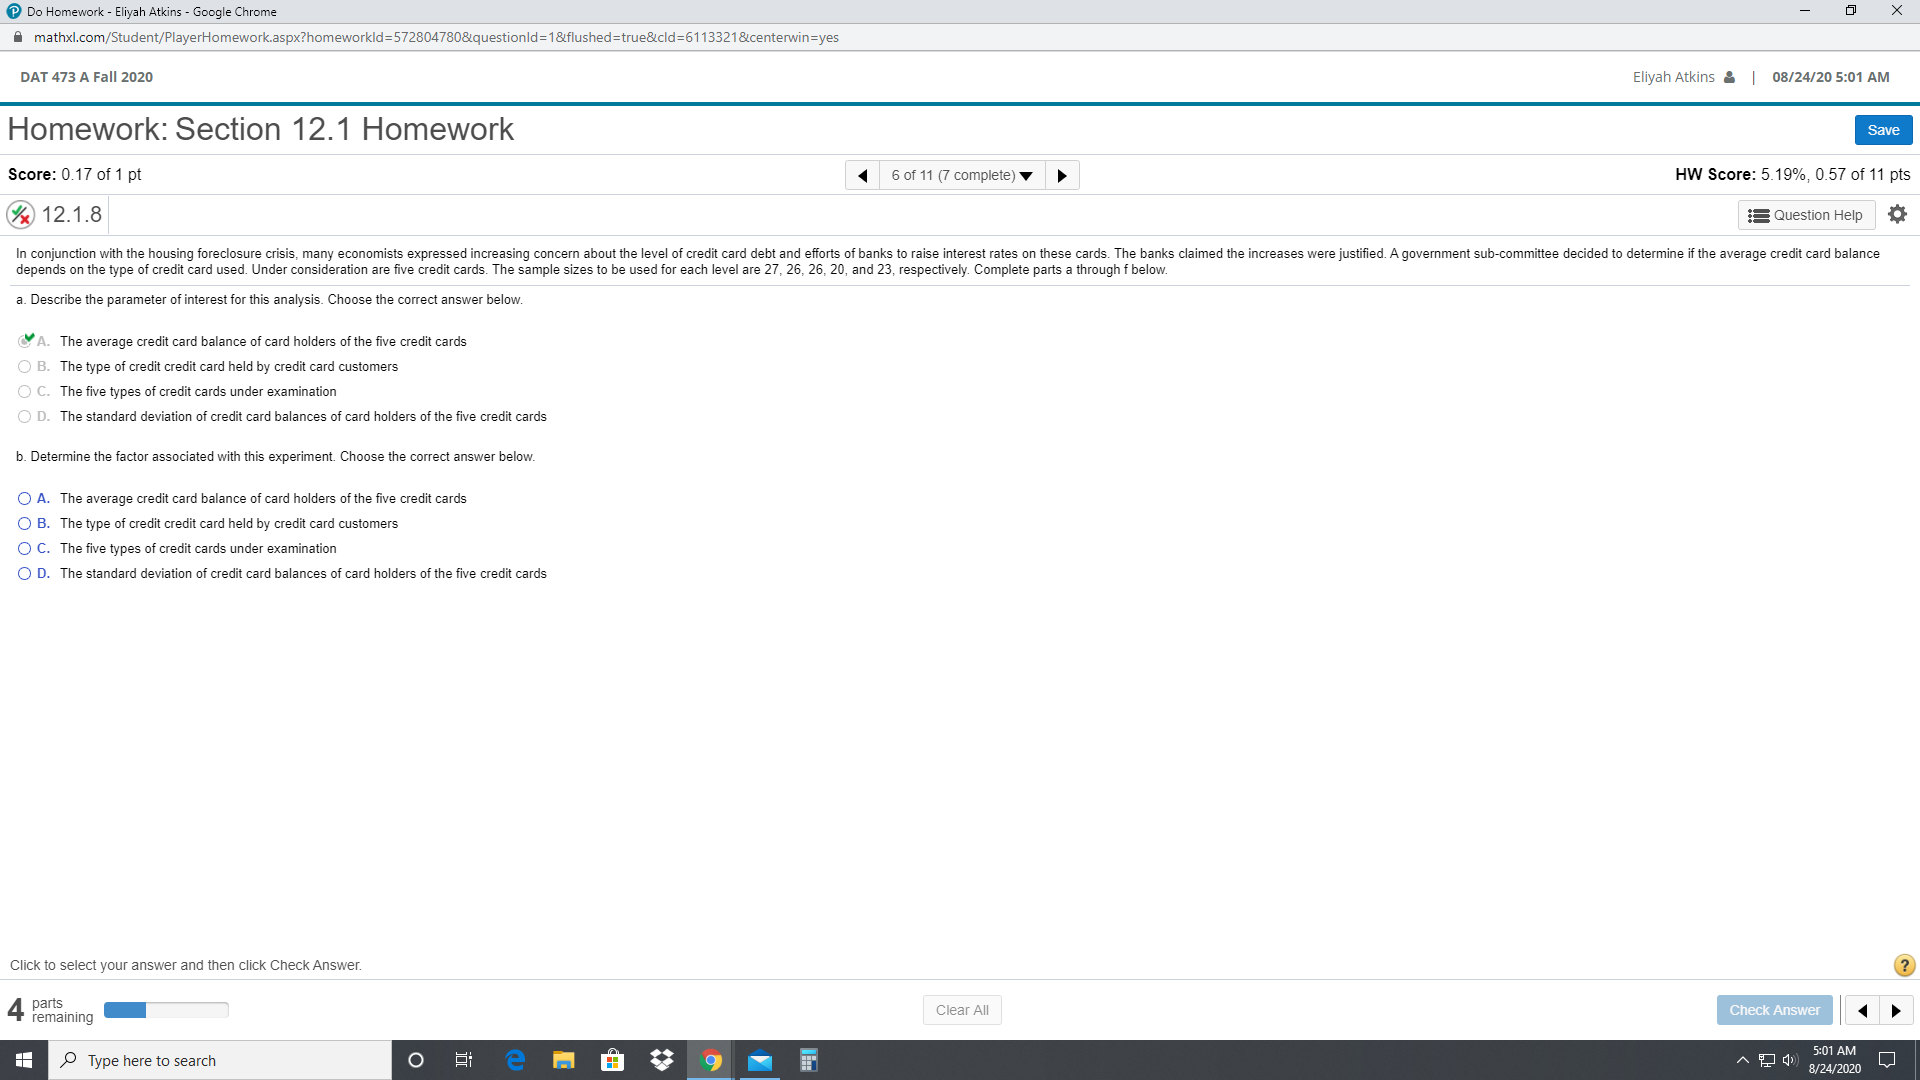
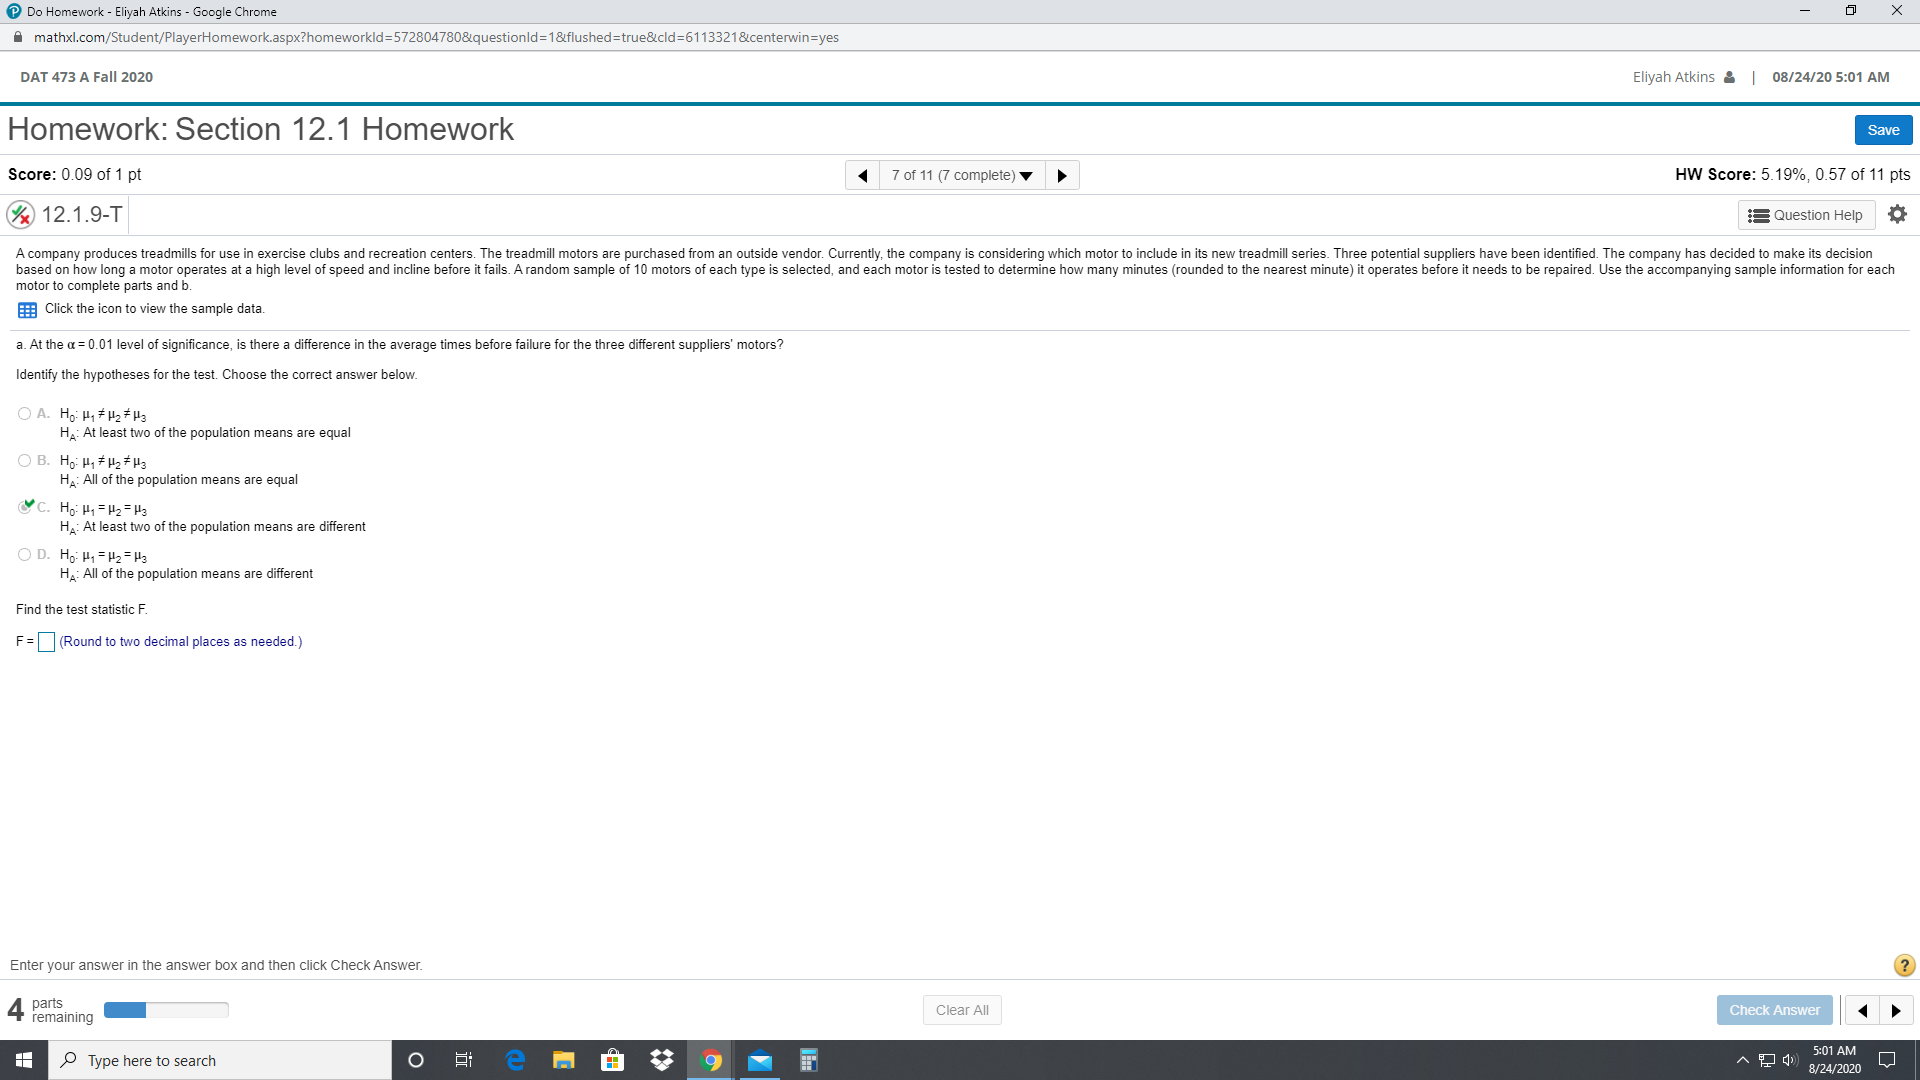
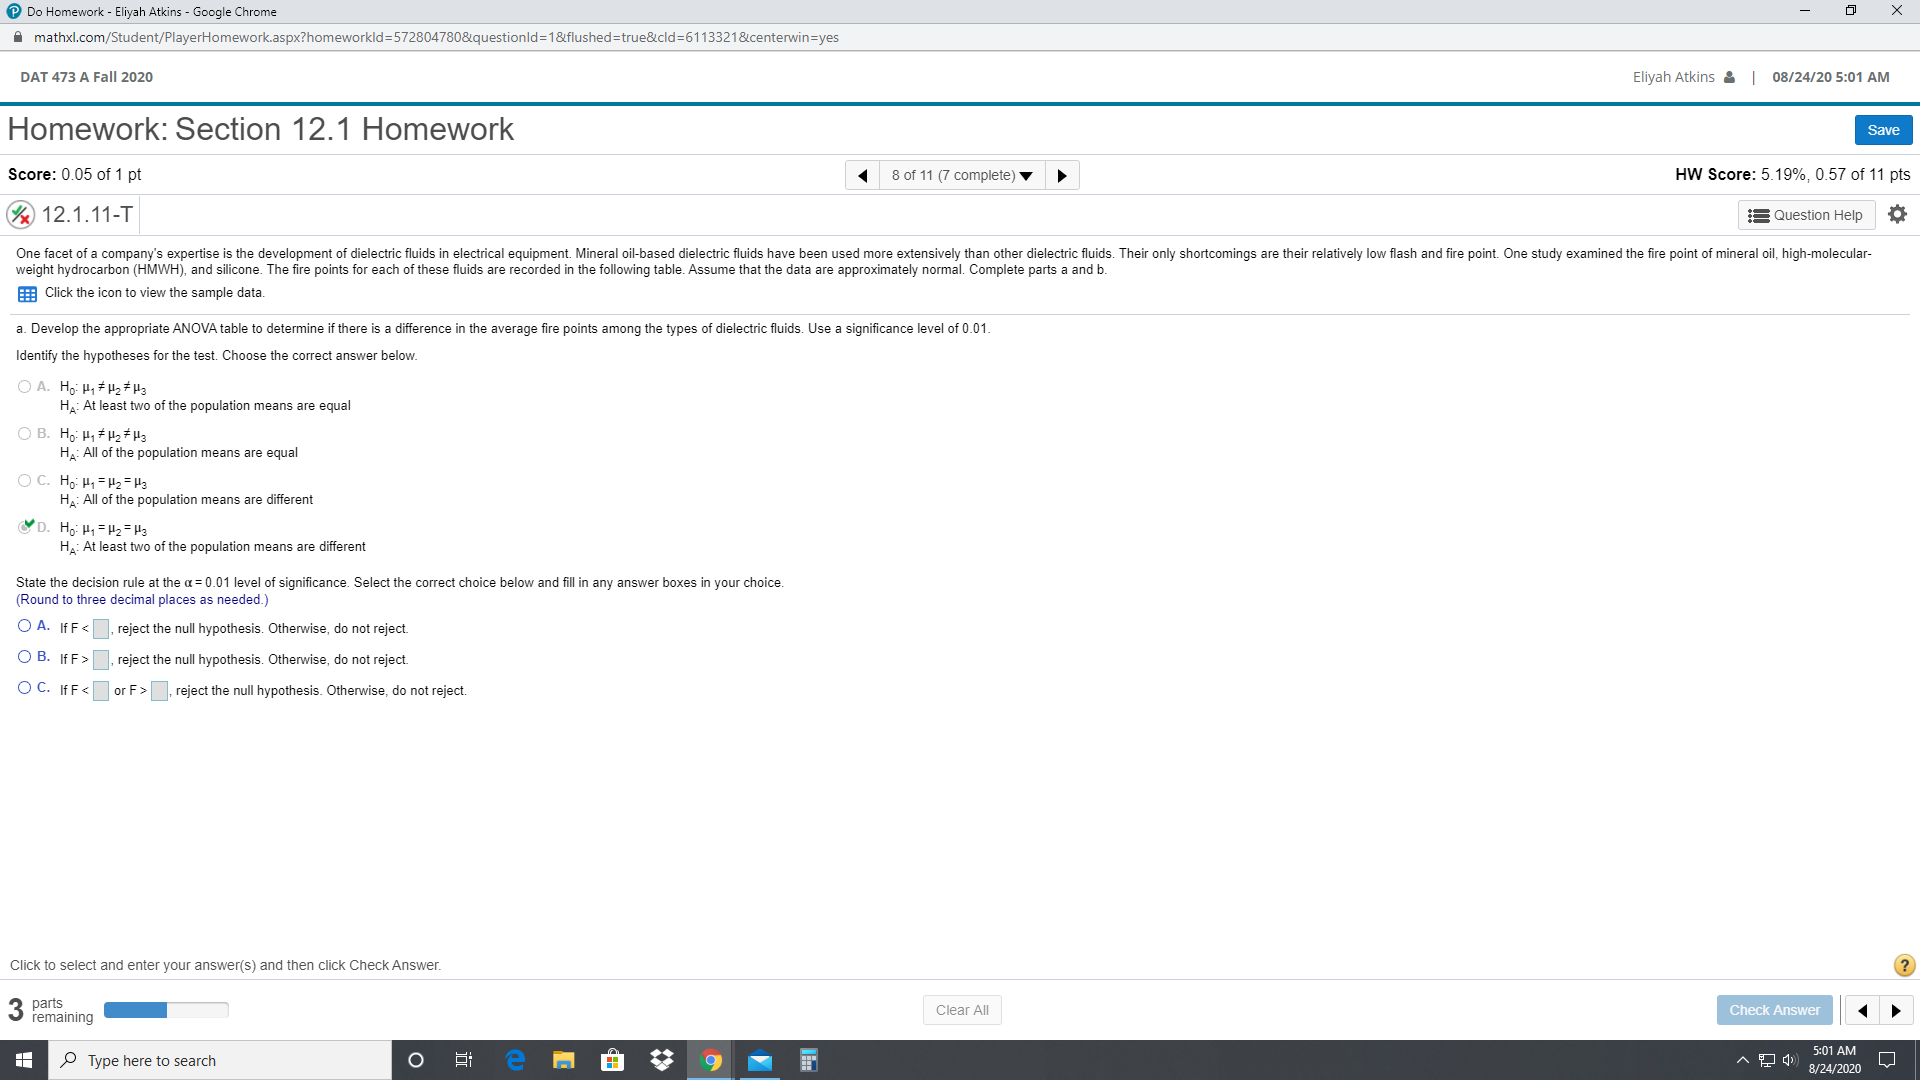
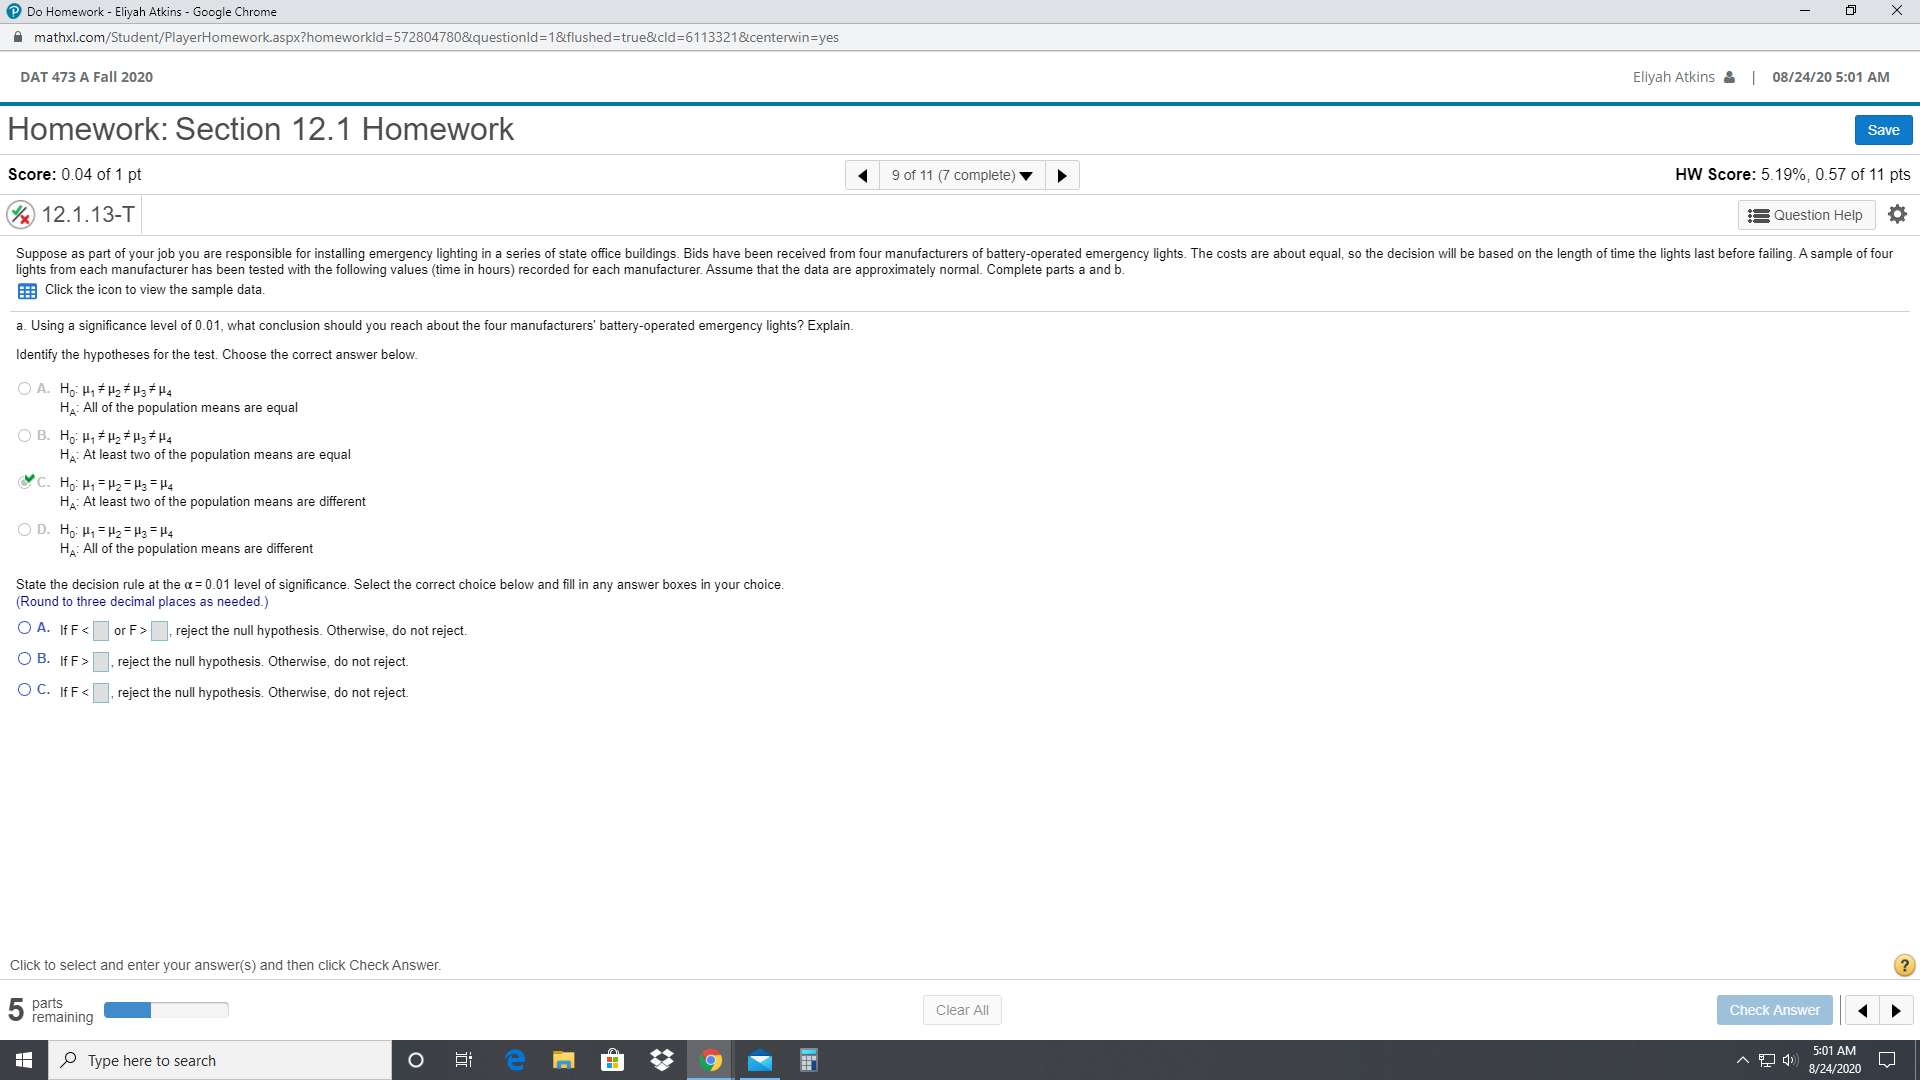
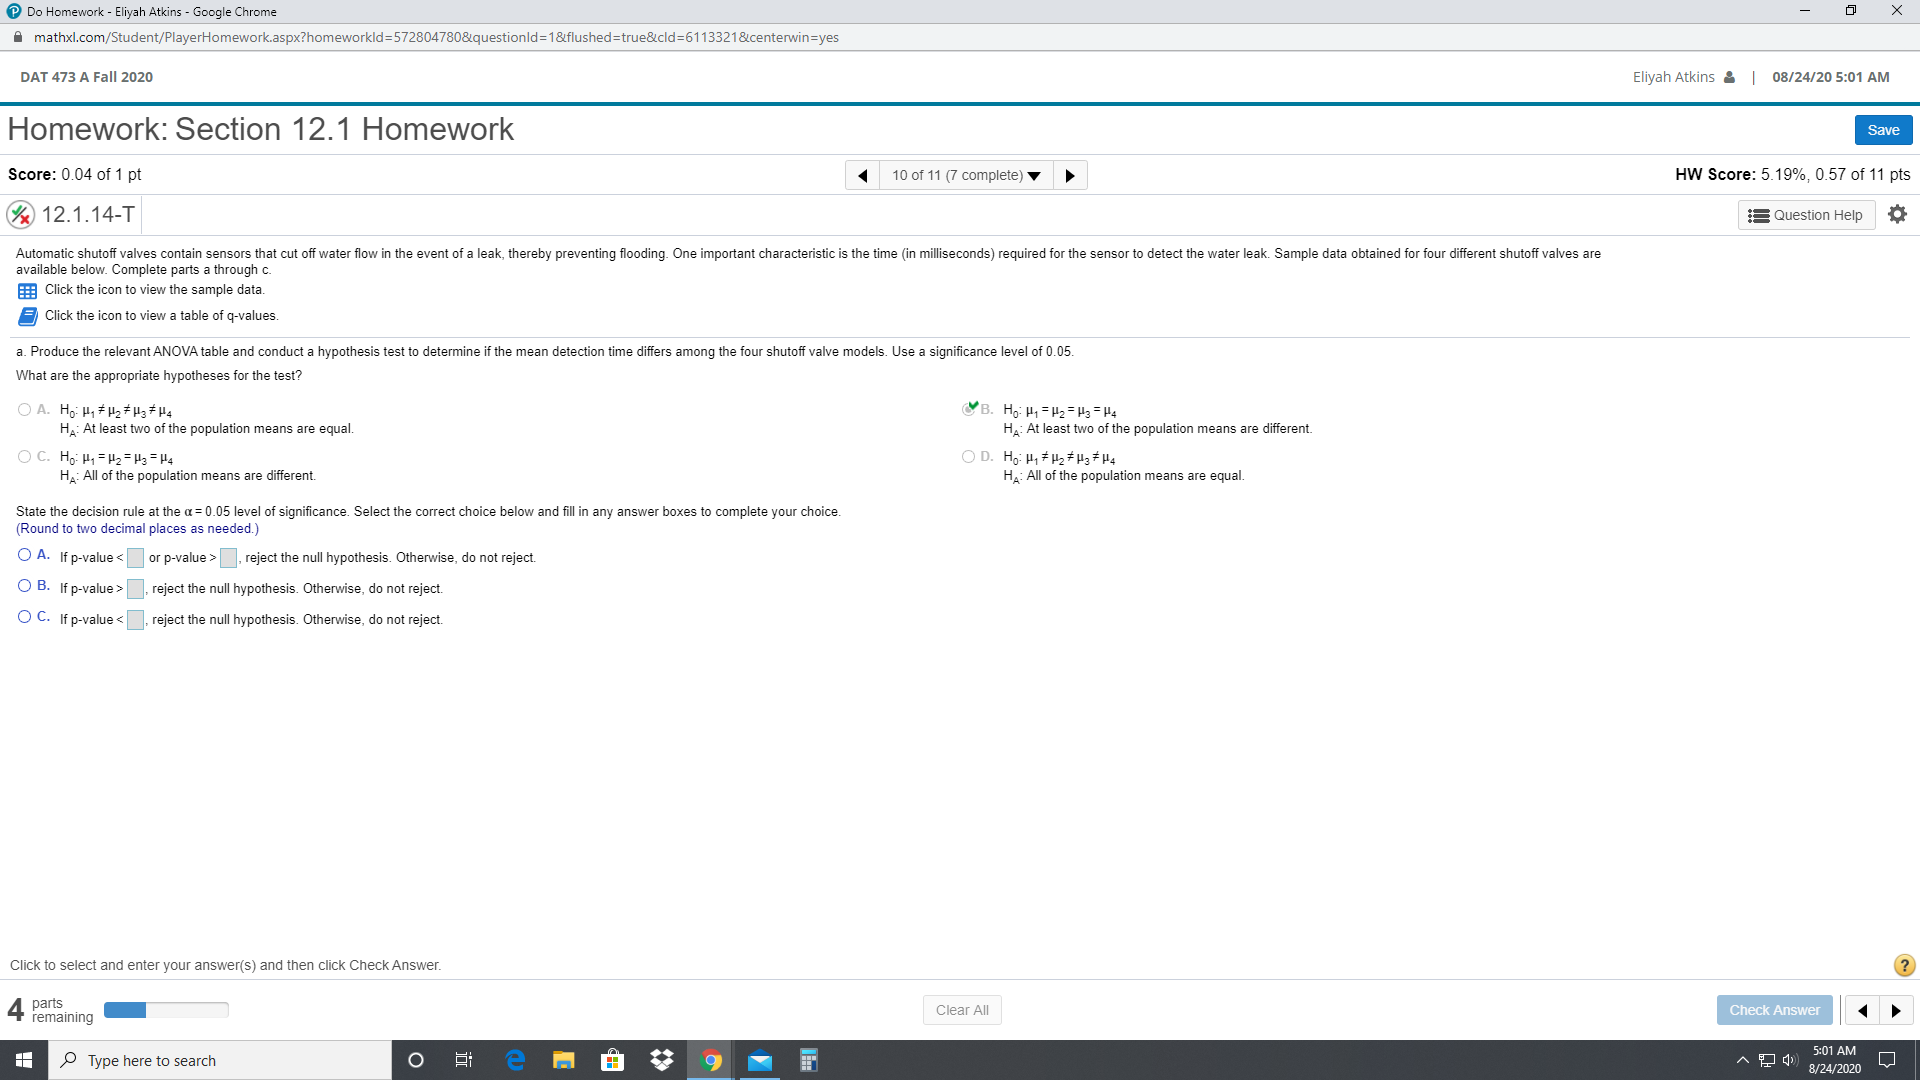
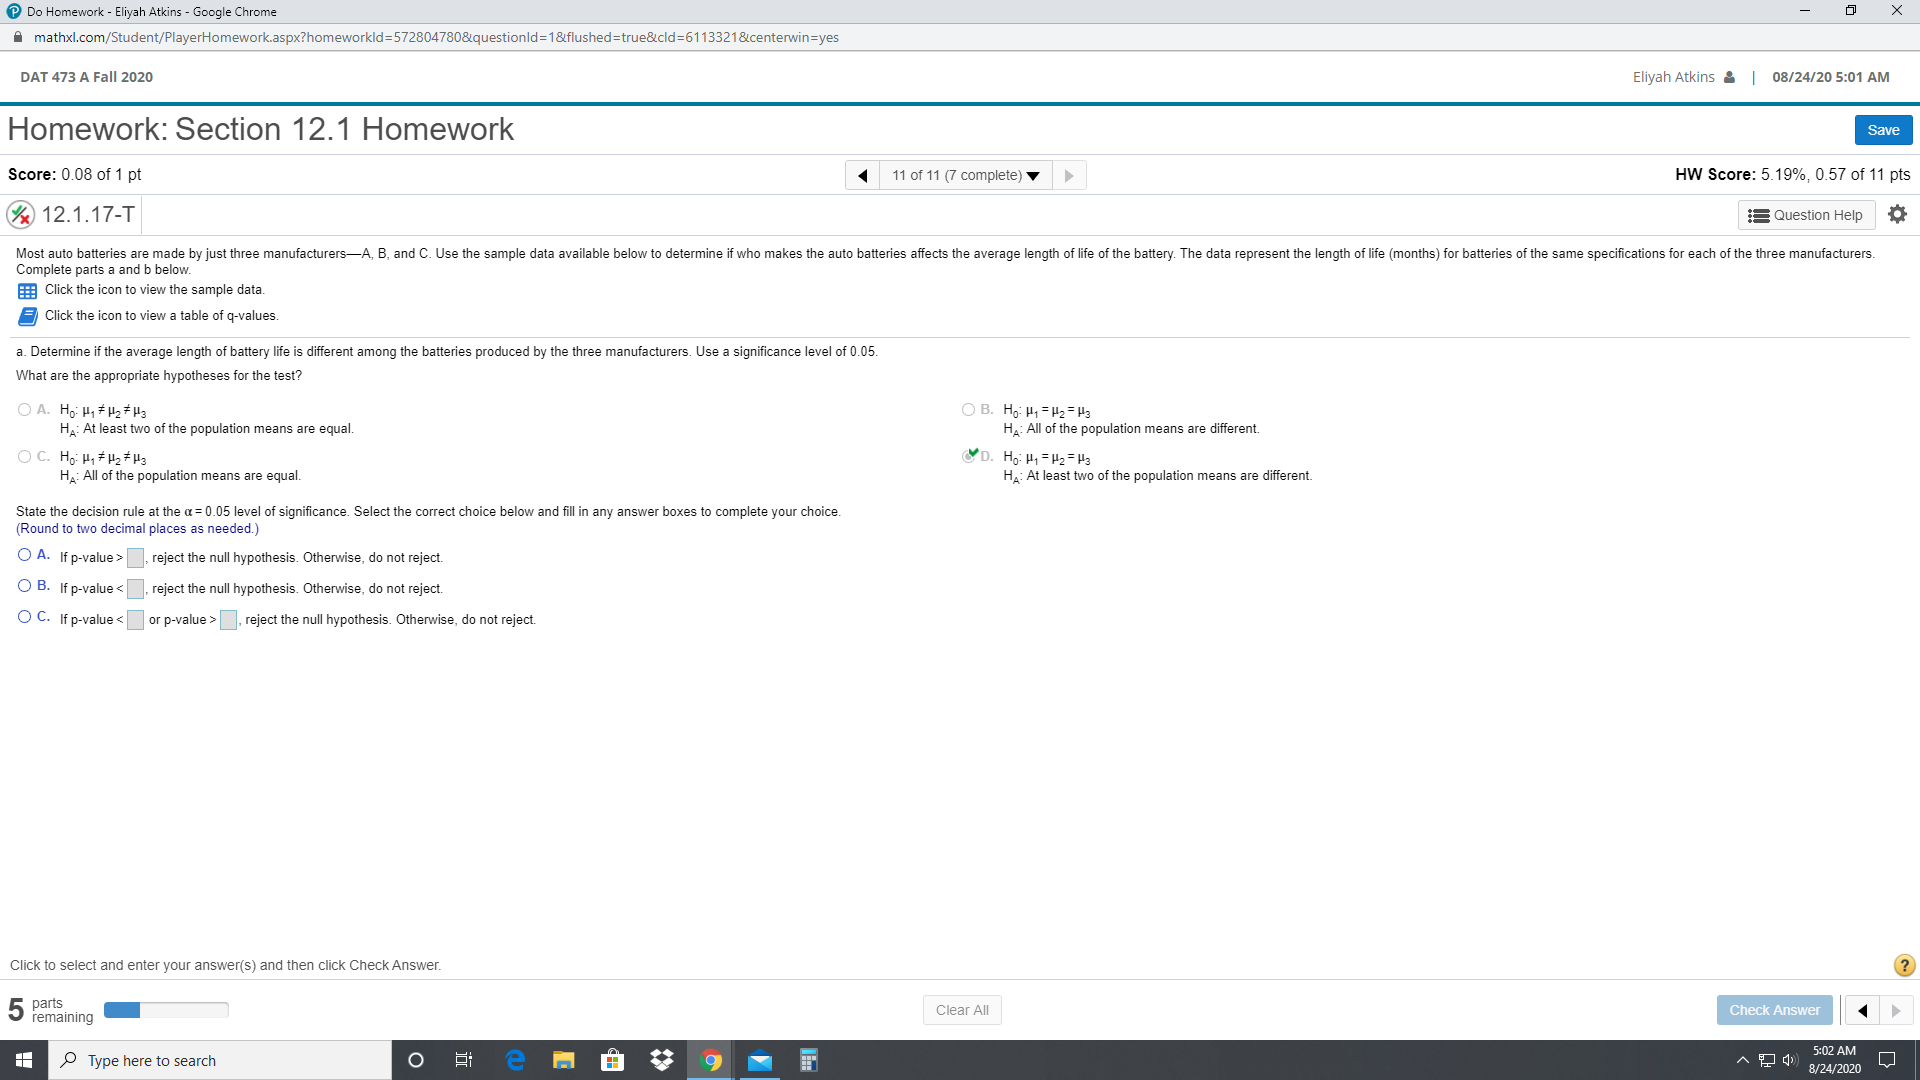
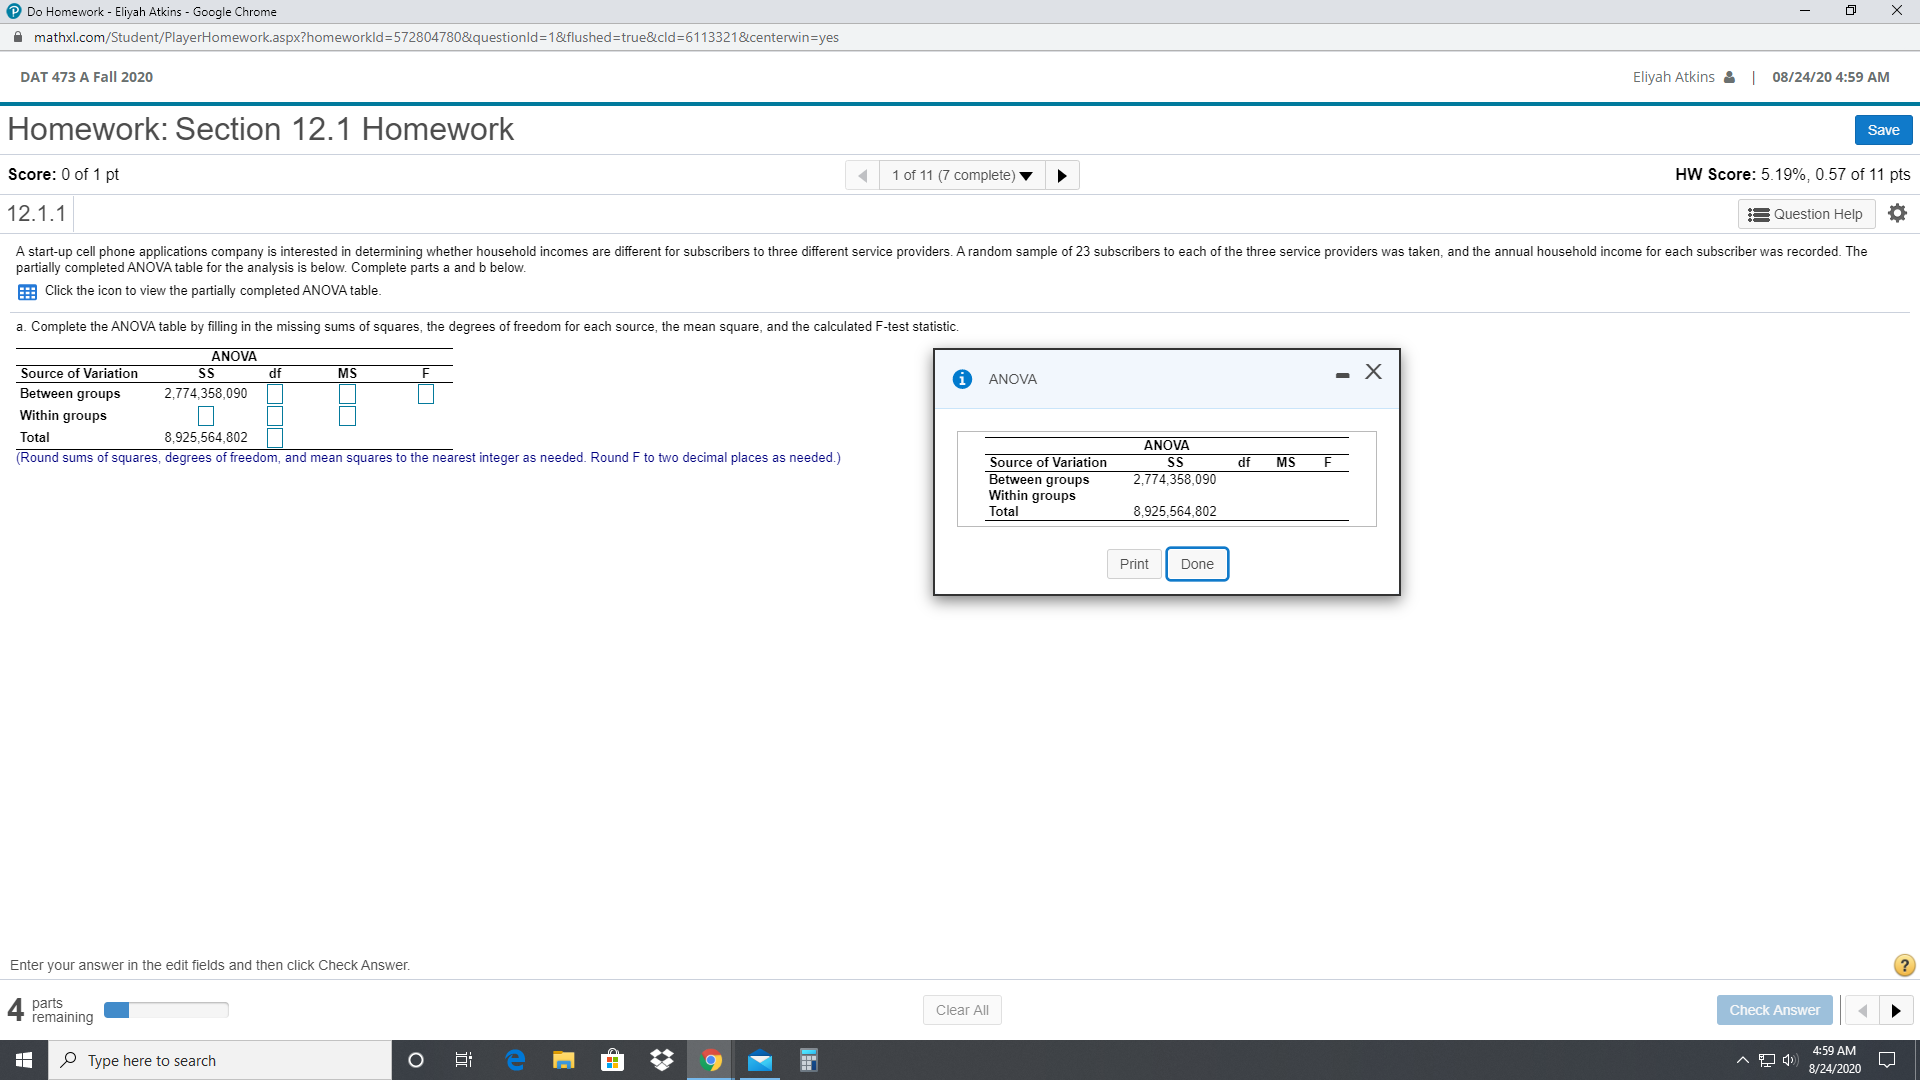
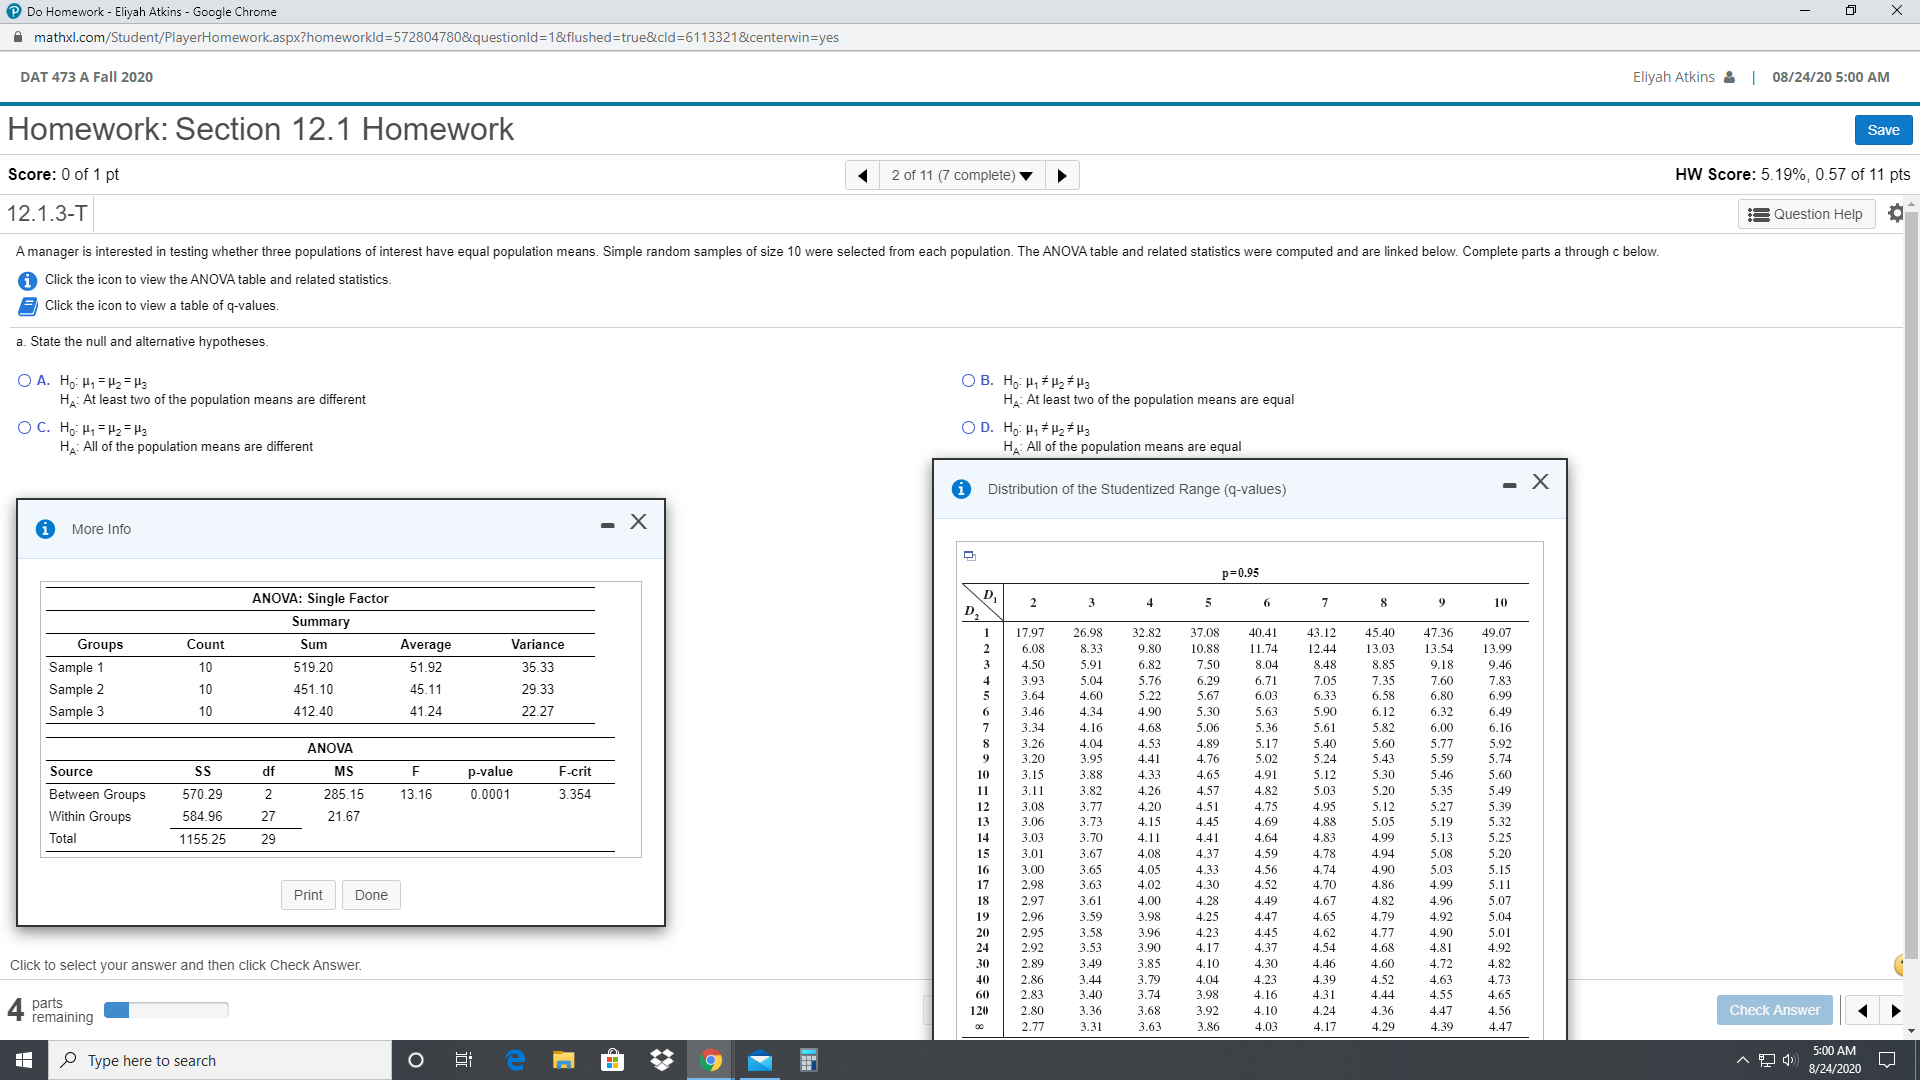
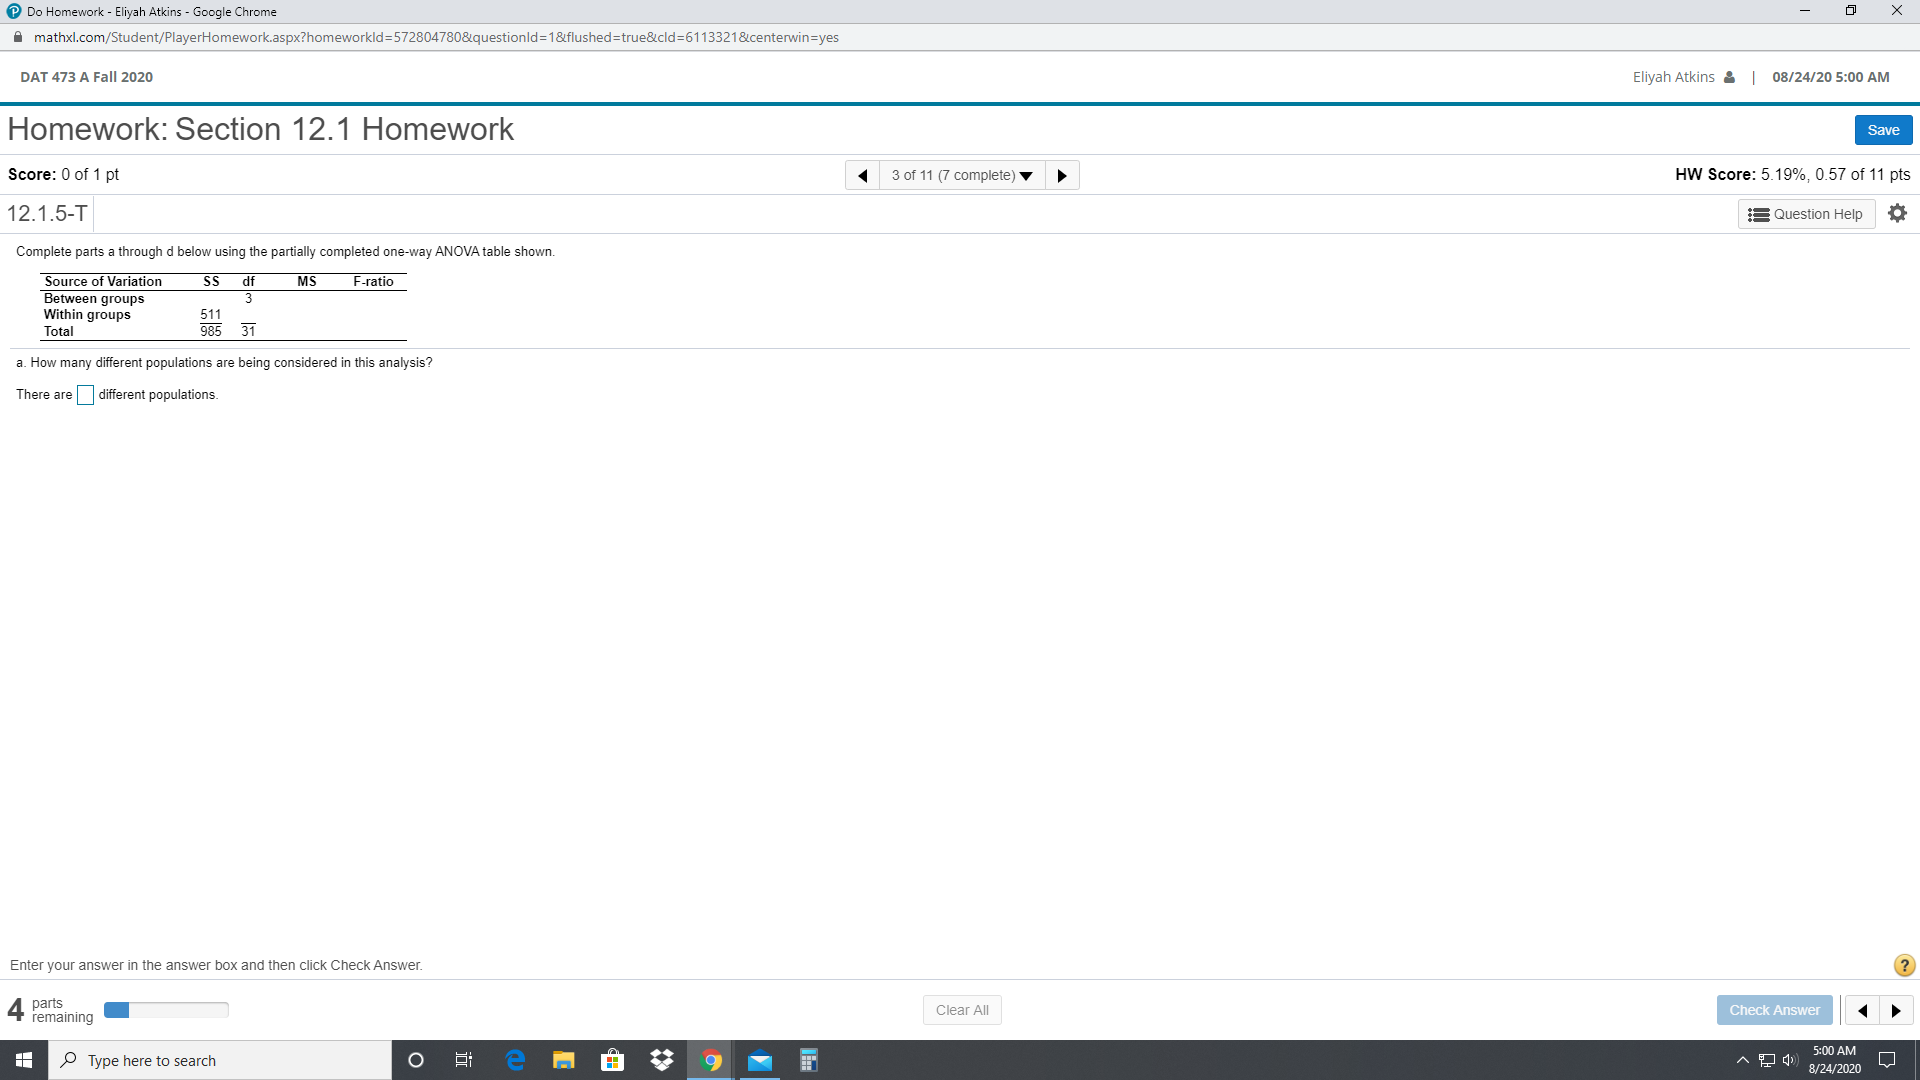
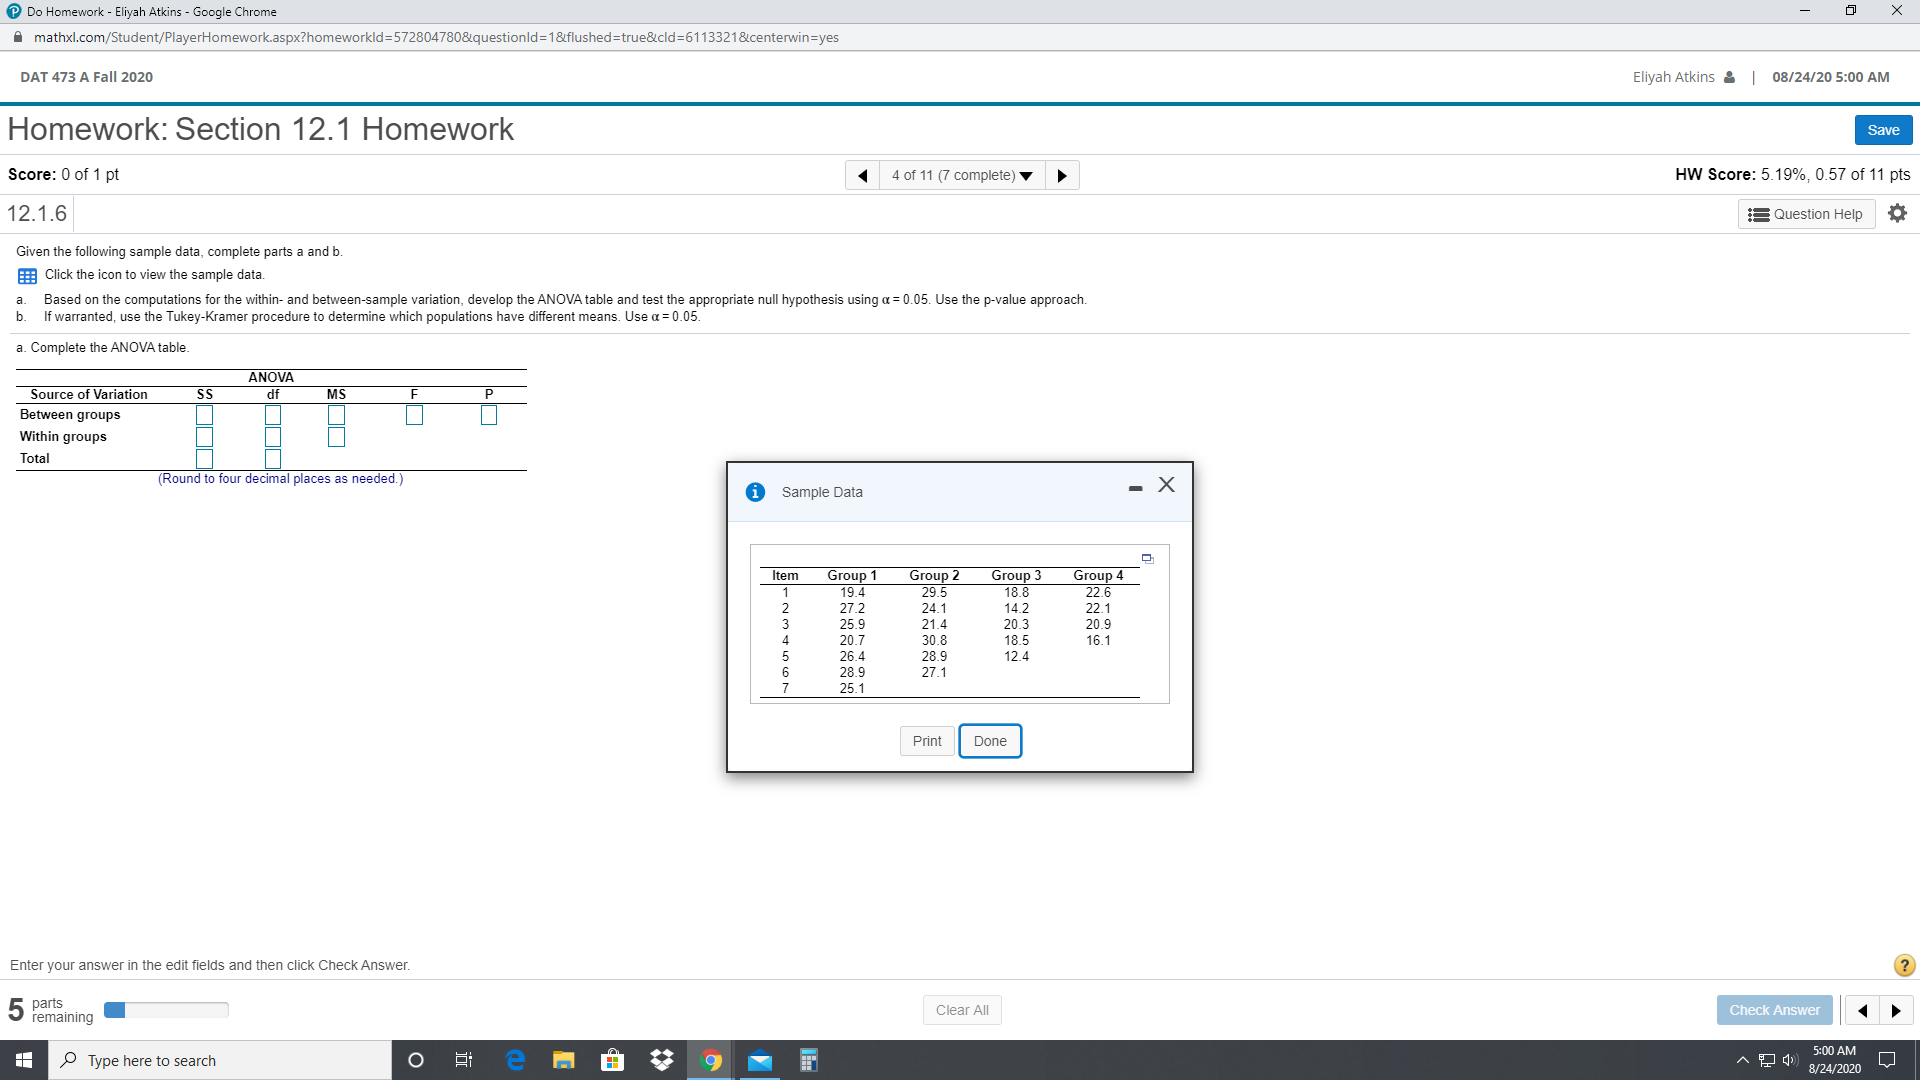
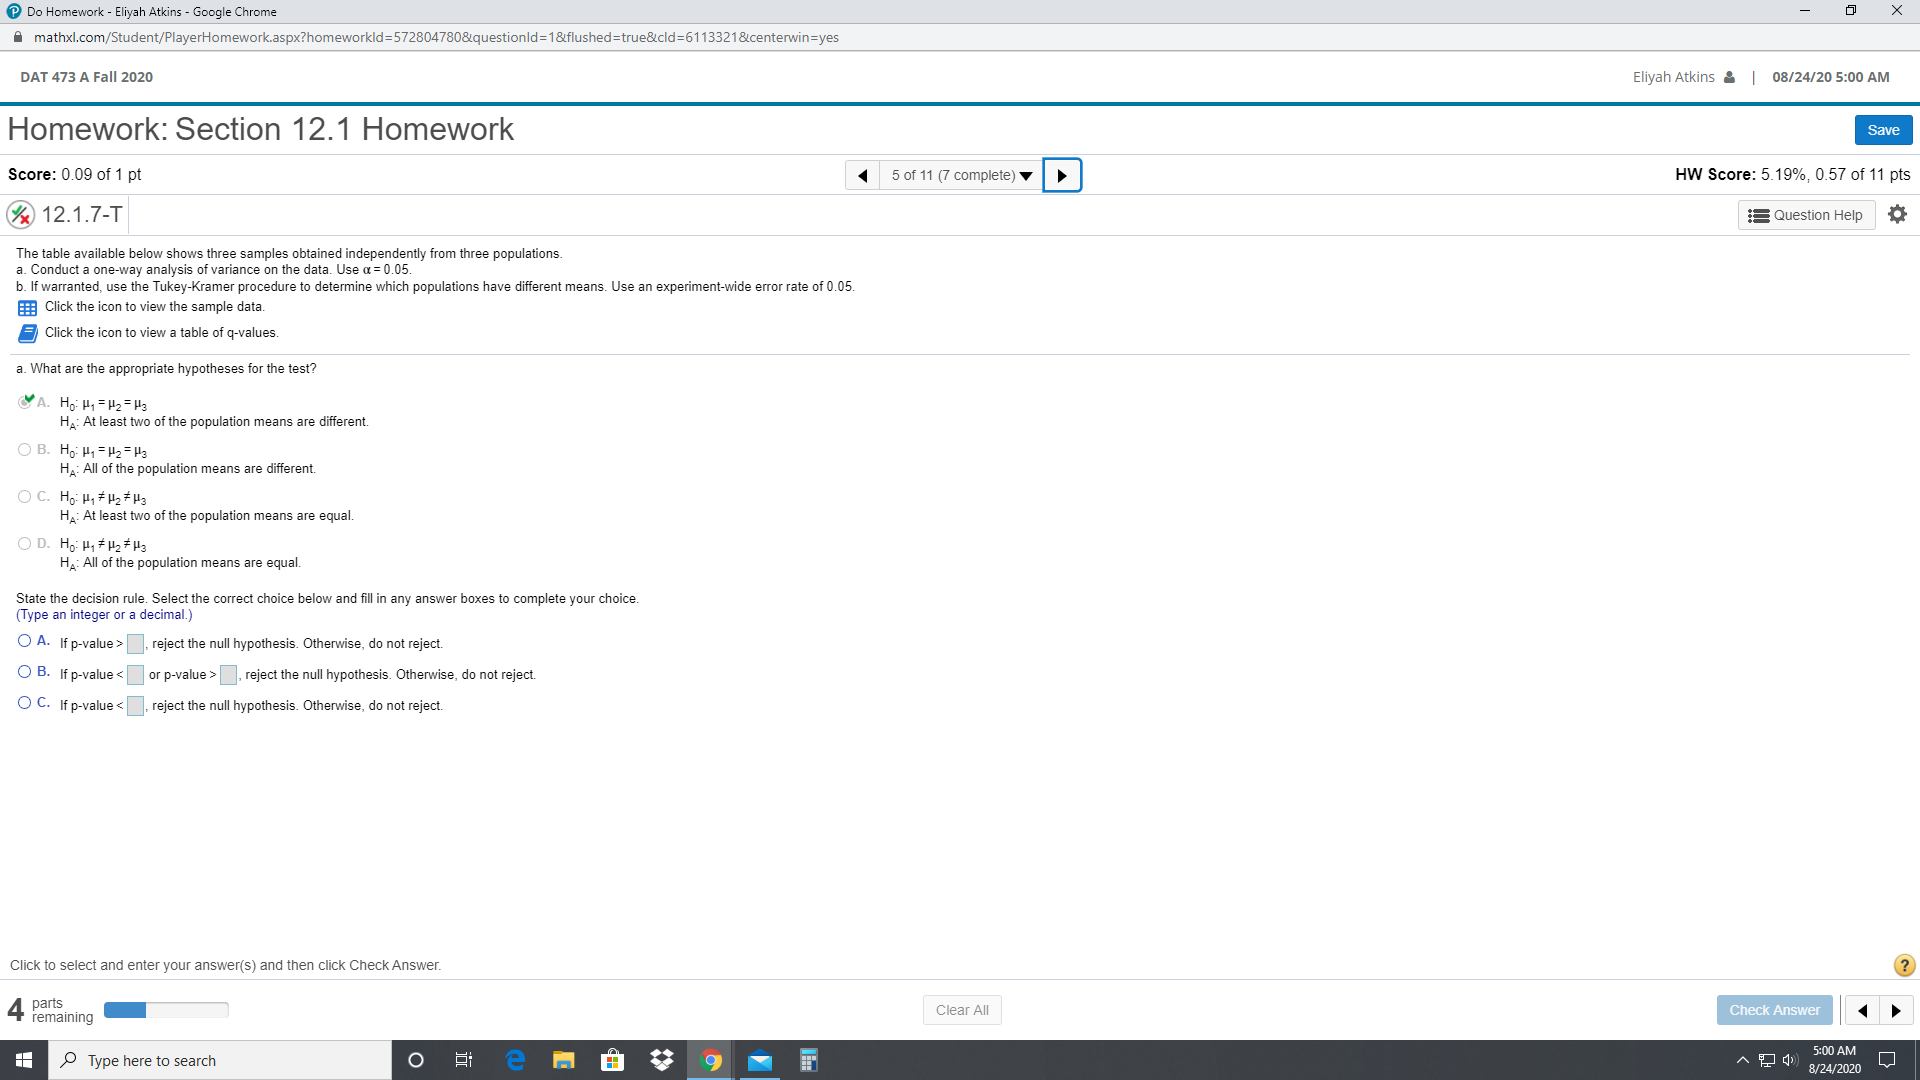
Do Homework - Eliyah Atkins - Google Chrome X mathxl.com/Student/PlayerHomework.aspx?homeworkld=572804780&questionld=1&flushed=true&cld=6113321¢erwin=yes DAT 473 A Fall 2020 Eliyah Atkins & | 08/24/20 5:01 AM Homework: Section 12.1 Homework Save Score: 0.17 of 1 pt 6 of 11 (7 complete) HW Score: 5.19%, 0.57 of 11 pts X 12.1.8 Question Help In conjunction with the housing foreclosure crisis, many economists expressed increasing concern about the level of credit card debt and efforts of banks to raise interest rates on these cards. The banks claimed the increases were justified. A government sub-committee decided to determine if the average credit card balance depends on the type of credit card used. Under consideration are five credit cards. The sample sizes to be used for each level are 27, 26, 26, 20, and 23, respectively. Complete parts a through f below. a. Describe the parameter of interest for this analysis. Choose the correct answer below. A. The average credit card balance of card holders of the five credit cards O B. The type of credit credit card held by credit card customers O C. The five types of credit cards under examination O D. The standard deviation of credit card balances of card holders of the five credit cards b. Determine the factor associated with this experiment. Choose the correct answer below. O A. The average credit card balance of card holders of the five credit cards O B. The type of credit credit card held by credit card customers O C. The five types of credit cards under examination O D. The standard deviation of credit card balances of card holders of the five credit cards Click to select your answer and then click Check Answer. parts 4 P remaining Clear All Check Answer Type here to search O 5:01 AM A 8/24/2020Do Homework - Eliyah Atkins - Google Chrome X mathxl.com/Student/PlayerHomework.aspx?homeworkld=572804780&questionld=1&flushed=true&cld=6113321¢erwin=yes DAT 473 A Fall 2020 Eliyah Atkins & | 08/24/20 5:01 AM Homework: Section 12.1 Homework Save Score: 0.09 of 1 pt 7 of 11 (7 complete) HW Score: 5.19%, 0.57 of 11 pts X 12.1.9-T Question Help A company produces treadmills for use in exercise clubs and recreation centers. The treadmill motors are purchased from an outside vendor. Currently, the company is considering which motor to include in its new treadmill series. Three potential suppliers have been identified. The company has decided to make its decision based on how long a motor operates at a high level of speed and incline before it fails. A random sample of 10 motors of each type is selected, and each motor is tested to determine how many minutes (rounded to the nearest minute) it operates before it needs to be repaired. Use the accompanying sample information for each motor to complete parts and b. Click the icon to view the sample data. a. At the a = 0.01 level of significance, is there a difference in the average times before failure for the three different suppliers' motors? Identify the hypotheses for the test. Choose the correct answer below. O A. Ho- My # H2 # H3 HA: At least two of the population means are equal O B. Ho: H, # H2 # H3 HA: All of the population means are equal &C. Ho- H, = H2 = Hg HA: At least two of the population means are different OD. Ho- H1 = H2 = Hg HA: All of the population means are different Find the test statistic F. F=(Round to two decimal places as needed.) Enter your answer in the answer box and then click Check Answer. parts 4 P remaining Clear All Check Answer Type here to search O 5:01 AM A 8/24/2020Do Homework - Eliyah Atkins - Google Chrome X mathxl.com/Student/PlayerHomework.aspx?homeworkld=5728047808questionld=1&flushed=true&cld=6113321¢erwin=yes DAT 473 A Fall 2020 Eliyah Atkins & | 08/24/20 5:01 AM Homework: Section 12.1 Homework Save Score: 0.05 of 1 pt 8 of 11 (7 complete) HW Score: 5.19%, 0.57 of 11 pts X 12.1.11-T Question Help One facet of a company's expertise is the development of dielectric fluids in electrical equipment. Mineral oil-based dielectric fluids have been used more extensively than other dielectric fluids. Their only shortcomings are their relatively low flash and fire point. One study examined the fire point of mineral oil, high-molecular- weight hydrocarbon (HMWH), and silicone. The fire points for each of these fluids are recorded in the following table. Assume that the data are approximately normal. Complete parts a and b. Click the icon to view the sample data. a. Develop the appropriate ANOVA table to determine if there is a difference in the average fire points among the types of dielectric fluids. Use a significance level of 0.01. Identify the hypotheses for the test. Choose the correct answer below. O A. Ho: H, # H2 # H3 HA: At least two of the population means are equal O B. Ho- Hq # H2 # Hg HA: All of the population means are equal O C. Ho- H, = H2 = H3 HA: All of the population means are different D. Ho- H1 = H2 = H3 HA: At least two of the population means are different State the decision rule at the a = 0.01 level of significance. Select the correct choice below and fill in any answer boxes in your choice. Round to three decimal places as needed.) O A. If F , reject the null hypothesis. Otherwise, do not reject. O C. IfF , reject the null hypothesis. Otherwise, do not reject. Click to select and enter your answer(s) and then click Check Answer. 3 parts remaining Clear All Check Answer Type here to search O 5:01 AM A 8/24/2020Do Homework - Eliyah Atkins - Google Chrome X mathxl.com/Student/PlayerHomework.aspx?homeworkld=572804780&questionld=1&flushed=true&cld=6113321¢erwin=yes DAT 473 A Fall 2020 Eliyah Atkins & | 08/24/20 5:01 AM Homework: Section 12.1 Homework Save Score: 0.04 of 1 pt 9 of 11 (7 complete) HW Score: 5.19%, 0.57 of 11 pts X 12.1.13-T Question Help Suppose as part of your job you are responsible for installing emergency lighting in a series of state office buildings. Bids have been received from four manufacturers of battery-operated emergency lights. The costs are about equal, so the decision will be based on the length of time the lights last before failing. A sample of four lights from each manufacturer has been tested with the following values (time in hours) recorded for each manufacturer. Assume that the data are approximately normal. Complete parts a and b. Click the icon to view the sample data. a. Using a significance level of 0.01, what conclusion should you reach about the four manufacturers' battery-operated emergency lights? Explain. Identify the hypotheses for the test. Choose the correct answer below. O A. Ho: H, # H2# H3 # H4 HA: All of the population means are equal O B. Ho: H, # H2 # H3 # H4 HA: At least two of the population means are equal C. Ho: H, = H2 = H3 = H4 HA: At least two of the population means are different O D. Ho: H, = H2 = Hy = H4 HA: All of the population means are different State the decision rule at the a = 0.01 level of significance. Select the correct choice below and fill in any answer boxes in your choice. (Round to three decimal places as needed.) O A. IfF , reject the null hypothesis. Otherwise, do not reject. O B. IfF> , reject the null hypothesis. Otherwise, do not reject. O C. IfF , reject the null hypothesis. Otherwise, do not reject. O B. If p-value > , reject the null hypothesis. Otherwise, do not reject. O C. If p-value , reject the null hypothesis. Otherwise, do not reject. O B. If p-value ], reject the null hypothesis. Otherwise, do not reject. Click to select and enter your answer(s) and then click Check Answer. 5 remaining Clear All Check Answer Type here to search O 5:02 AM A ) 8/24/2020Do Homework - Eliyah Atkins - Google Chrome X mathxl.com/Student/PlayerHomework.aspx?homeworkld=572804780&questionld=1&flushed=true&cld=6113321¢erwin=yes DAT 473 A Fall 2020 Eliyah Atkins & | 08/24/20 4:59 AM Homework: Section 12.1 Homework Save Score: 0 of 1 pt 4 1 of 11 (7 complete) HW Score: 5.19%, 0.57 of 11 pts 12.1.1 Question Help A start-up cell phone applications company is interested in determining whether household incomes are different for subscribers to three different service providers. A random sample of 23 subscribers to each of the three service providers was taken, and the annual household income for each subscriber was recorded. The partially completed ANOVA table for the analysis is below. Complete parts a and b below. Click the icon to view the partially completed ANOVA table. a. Complete the ANOVA table by filling in the missing sums of squares, the degrees of freedom for each source, the mean square, and the calculated F-test statistic. ANOVA Source of Variation SS df MS Between groups i ANOVA - X 2,774,358,090 Within groups Total 8,925,564,802 (Round sums of squares, degrees of freedom, and mean squares to the nearest integer as needed. Round F to two decimal places as needed.) ANOVA Source of Variation SS df MS F Between groups 2,774,358,090 Within groups Total 8,925,564,802 Print Done Enter your answer in the edit fields and then click Check Answer. ? parts 4 P remaining Clear All Check Answer 1 Type here to search O 4:59 AM A 8/24/2020 LJDo Homework - Eliyah Atkins - Google Chrome mathxl.com/Student/PlayerHomework.aspx?homeworkld=5728047808questionld=1&flushed=true&cld=6113321¢erwin=yes DAT 473 A Fall 2020 Eliyah Atkins & | 08/24/20 5:00 AM Homework: Section 12.1 Homework Score: 0 of 1 pt 2 of 11 (7 complete) HW Score: 5.19%, 0.57 of 11 pts 12.1.3-T Question Help A manager is interested in testing whether three populations of interest have equal population means. Simple random samples of size 10 were selected from each population. The ANOVA table and related statistics were computed and are linked below. Complete parts a through c below. i Click the icon to view the ANOVA table and related statistics. Click the icon to view a table of q-values a. State the null and alternative hypotheses. OA. Ho- H1 = H2 = Hg OB. Ho- H, # H2# H3 HA: At least two of the population means are different HA: At least two of the population means are equal O C. Ho- H, = H2 = H OD. HOW, # H2 # H3 HA: All of the population means are different HA: All of the population means are equal i Distribution of the Studentized Range (q-values) X More Info - X P=0.95 ANOVA: Single Factor 3 5 10 Summary 26.98 Variance 32.82 37.08 40.41 49.07 Count Average 43.12 15.40 47.36 Groups Sum 6.08 8.33 9.80 10.88 11.74 12.44 13.03 13.5 13.99 Sample 1 519.20 1.92 35.33 4.50 5.91 6.82 7.50 8.04 8.48 8.85 9.18 9.46 Sample 2 7 83 10 451.10 45.11 29.33 3.93 5.04 5,76 6.29 .71 7.05 7.35 3.64 4.60 5.22 5.67 6.03 6.33 6.58 6.80 690 Sample 3 10 412.40 11.24 22.27 3.46 4.34 4.90 5.30 5.63 5.90 6.12 6.32 6.49 3.34 1.16 4.68 5.06 5.36 5.61 5.82 6.00 6.16 ANOVA 3.26 4.53 4.89 5.17 5.40 5.60 5.77 5.92 3.20 3.9 4.76 5.02 Source SS d MS p-value -crit 3.15 3.88 4.65 4.91 5.30 5.46 5.60 Between Groups 13.16 0.0001 3.354 11 3.11 3.82 4.26 4.57 4 82 5.03 5.20 5.49 Within Groups IN 21.67 3.08 3.77 4.20 4.51 4 75 4.95 5.12 5.27 5.39 3.06 3.73 4.15 4.45 4 69 4.88 5.05 5.19 5.32 Total 1155.25 29 3.03 3.01 3.70 4.41 5.13 3.67 4.08 4.37 4.59 4.94 5.20 3.00 4.05 4 33 4.56 4.74 4.90 5.03 5.15 3.63 4.30 4 90 Print Done 2.98 4.02 4 52 4.70 4.86 5.11 2.97 3.61 1.28 4.49 4.67 4.82 4.96 5.07 20 2.96 2.95 3.59 4.79 5.04 3.58 3.96 4.23 4.45 4.62 4.77 4.90 5.01 24 2.92 3.53 3.90 4.17 4.37 4.54 4.68 4.81 4.92 Click to select your answer and then click Check Answer. 30 2.89 3.49 3.85 4.10 4.30 4.46 4.60 4.72 4.82 2.86 3.44 4.04 2.83 1.79 4.23 4.39 4.52 4.63 4.73 parts 3.40 3.74 298 4.44 remaining 120 2.80 3.36 3.68 3.92 4.10 4.24 4.36 4.47 4.56 Check Answer 2.77 3.31 3.63 3.86 4.03 4.17 4.29 4.39 4.47 Type here to search O 5:00 AM ~ [ 8/24/2020Do Homework - Eliyah Atkins - Google Chrome X mathxl.com/Student/PlayerHomework.aspx?homeworkld=572804780&questionld=1&flushed=true&cld=6113321¢erwin=yes DAT 473 A Fall 2020 Eliyah Atkins & | 08/24/20 5:00 AM Homework: Section 12.1 Homework Save Score: 0 of 1 pt 3 of 11 (7 complete) HW Score: 5.19%, 0.57 of 11 pts 12.1.5-T Question Help Complete parts a through d below using the partially completed one-way ANOVA table shown. Source of Variation SS df MS F-ratio Between groups Within groups 511 Total 985 31 a. How many different populations are being considered in this analysis? There are different populations. Enter your answer in the answer box and then click Check Answer. parts 4 P remaining Clear All Check Answer Type here to search O 5:00 AM A 8/24/2020Do Homework - Eliyah Atkins - Google Chrome X mathxl.com/Student/PlayerHomework.aspx?homeworkld=572804780&questionld=1&flushed=true&cld=6113321¢erwin=yes DAT 473 A Fall 2020 Eliyah Atkins & | 08/24/20 5:00 AM Homework: Section 12.1 Homework Save Score: 0 of 1 pt 4 of 11 (7 complete) HW Score: 5.19%, 0.57 of 11 pts 12. 1.6 Question Help Given the following sample data, complete parts a and b. Click the icon to view the sample data. Based on the computations for the within- and between-sample variation, develop the ANOVA table and test the appropriate null hypothesis using a = 0.05. Use the p-value approach. If warranted, use the Tukey-Kramer procedure to determine which populations have different means. Use a = 0.05. a. Complete the ANOVA table. ANOVA Source of Variation SS df MS Between groups Within groups Total (Round to four decimal places as needed.) i Sample Data - X Item NOMIAWN- Group Group Group 3 Group 4 19.4 29.5 18.8 22.6 21-2 24.1 14.2 22.1 25.9 21.4 20.3 20.9 20.7 28 9 18.5 16.1 26.4 12.4 28.9 27.1 25.1 Print Done Enter your answer in the edit fields and then click Check Answer. 5 remaining Clear All Check Answer Type here to search O 5:00 AM A 8/24/2020Do Homework - Eliyah Atkins - Google Chrome X mathxl.com/Student/PlayerHomework.aspx?homeworkld=5728047808questionld=1&flushed=true&cld=6113321¢erwin=yes DAT 473 A Fall 2020 Eliyah Atkins & | 08/24/20 5:00 AM Homework: Section 12.1 Homework Save Score: 0.09 of 1 pt 4 5 of 11 (7 complete) HW Score: 5.19%, 0.57 of 11 pts X 12.1.7-T Question Help The table available below shows three samples obtained independently from three populations. a. Conduct a one-way analysis of variance on the data. Use a = 0.05. b. If warranted, use the Tukey-Kramer procedure to determine which populations have different means. Use an experiment-wide error rate of 0.05. Click the icon to view the sample data. Click the icon to view a table of q-values. a. What are the appropriate hypotheses for the test? A. Ho: H, = H2 = H3 HA: At least two of the population means are different. O B. Ho- Hq = H2 = Ha HA: All of the population means are different. O C. Ho- H, # H2 # H3 HA: At least two of the population means are equal. OD. Ho- H, # H2 # H3 HA: All of the population means are equal. State the decision rule. Select the correct choice below and fill in any answer boxes to complete your choice. (Type an integer or a decimal.) O A. If p-value > , reject the null hypothesis. Otherwise, do not reject. O B. If p-value , reject the null hypothesis. Otherwise, do not reject. O C. If p-value
