I saw some solution from matlab in chegg. But,I need PYTHON.
PYTHON, PYTHON, PYTHON.
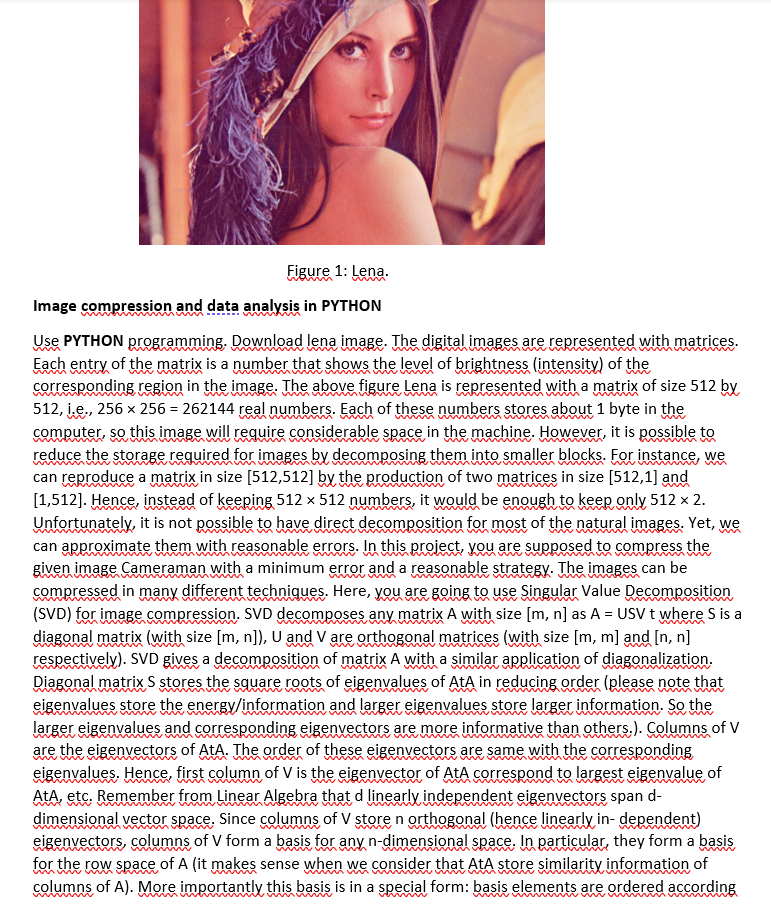
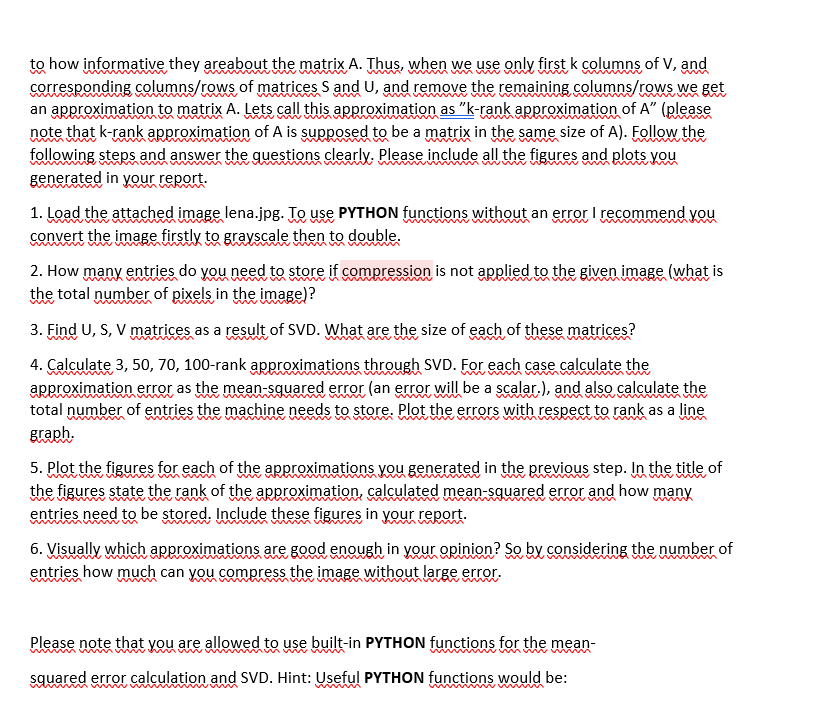
Figure 1: Lena. Image compression and data analysis in PYTHON Use PYTHON programming. Download lena image. The digital images are represented with matrices. Each entry of the matrix is a number that shows the level of brightness (intensity) of the corresponding region in the image. The above figure Lena is represented with a matrix of size 512 by 512, i.e., 256256=262144 real numbers. Each of these numbers stores about 1 byte in the computer, so this image will require considerable space in the machine. However, it is possible to reduce the storage required for images by decomposing them into smaller blocks. For instance, we can reproduce a matrix in size [512,512] by the production of two matrices in size [512,1] and [1,512]. Hence, instead of keeping 512512 numbers, it would be enough to keep only 5122. Unfortunately, it is not possible to have direct decomposition for most of the natural images. Yet, we can approximate them with reasonable errors. In this project, you are supposed to compress the given image Cameraman with a minimum error and a reasonable strategy. The images can be compressed in many different techniques. Here, you are going to use Singular Value Decomposition (SVD) for image compression. SVD decomposes any matrix A with size [m, n] as A = USV t where S is a diagonal matrix (with size [m,n] ), U and V are orthogonal matrices (with size [m,m] and [n,n] respectively). SVD gives a decomposition of matrix A with a similar application of diagonalization. Diagonal matrix S stores the square roots of eigenvalues of AtA in reducing order (please note that eigenvalues store the energy/information and larger eigenvalues store larger information. So the larger eigenvalues and corresponding eigenvectors are more informative than others.). Columns of V are the eigenvectors of AtA. The order of these eigenvectors are same with the corresponding eigenvalues. Hence, first column of V is the eigenvector of AtA correspond to largest eigenvalue of AtA, etc. Remember from Linear Algebra that d linearly independent eigenvectors span ddimensional vector space. Since columns of V store n orthogonal (hence linearly in- dependent) eigenvectors, columns of V form a basis for any n-dimensional space. In particular, they form a basis for the row space of A (it makes sense when we consider that AtA store similarity information of columns of A). More importantly this basis is in a special form: basis elements are ordered according to how informative they areabout the matrix A. Thus, when we use only first k columns of V, and corresponding columns/rows of matrices S and U, and remove the remaining columns/rows we get an approximation to matrix A. Lets call this approximation as "k-rank approximation of A" (please note that k-rank approximation of A is supposed to be a matrix in the same size of A). Follow the following steps and answer the questions clearly. Please include all the figures and plots you generated in your report. 1. Load the attached image lena.jpg. To use PYTHON functions without an error I recommend you convert the image firstly to grayscale then to double. 2. How many entries do you need to store if compression is not applied to the given image (what is the total number of pixels in the image)? 3. Find U,S,V matrices as a result of SVD. What are the size of each of these matrices? 4. Calculate 3, 50, 70, 100-rank approximations through SVD. For each case calculate the approximation error as the mean-squared error (an error will be a scalar.), and also calculate the total number of entries the machine needs to store. Plot the errors with respect to rank as a line graph. 5. Plot the figures for each of the approximations you generated in the previous step. In the title of the figures state the rank of the approximation, calculated mean-squared error and how many entries need to be stored. Include these figures in your report. 6. Visually which approximations are good enough in your opinion? So by considering the number of entries how much can you compress the image without large error. Please note that you are allowed to use built-in PYTHON functions for the mean- squared error calculation and SVD. Hint: Useful PYTHON functions would be