i share a data about finance prt and also shre a summary template so kimdly pick data and make summary accordingly tnx pls do as soon as possible just 3 hours left to submit
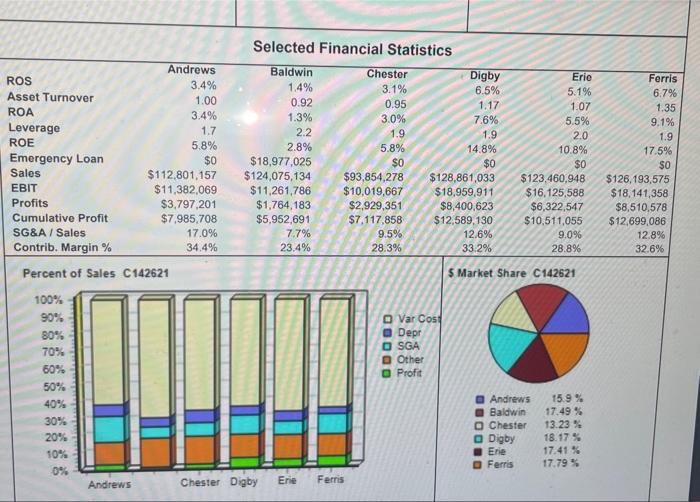
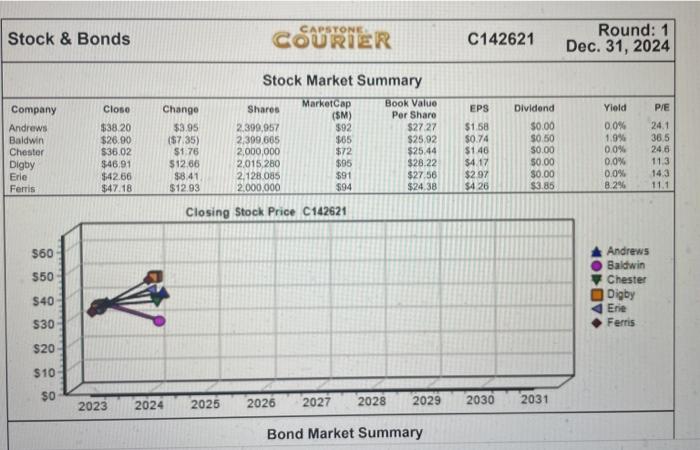
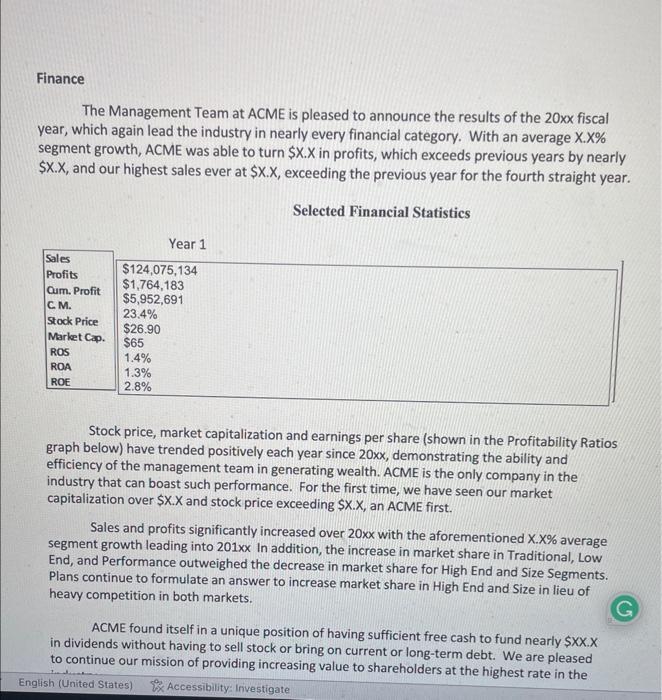
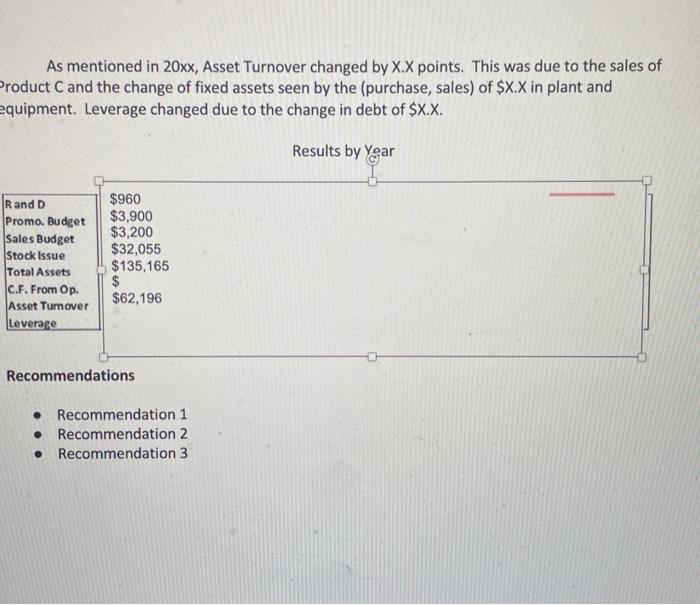
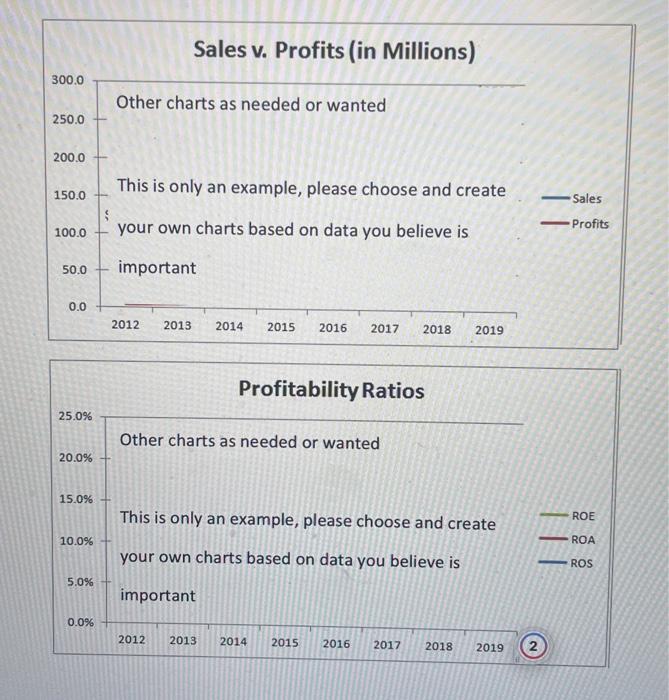
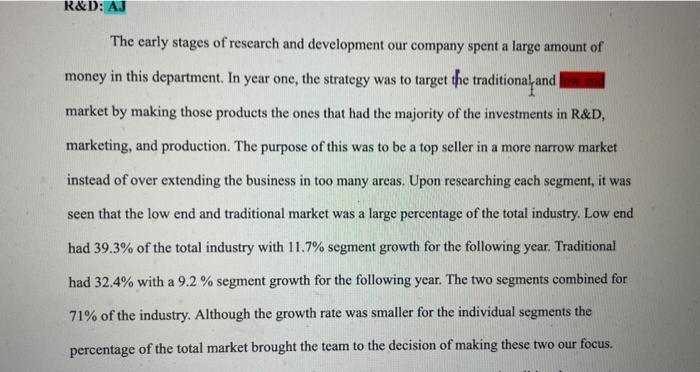
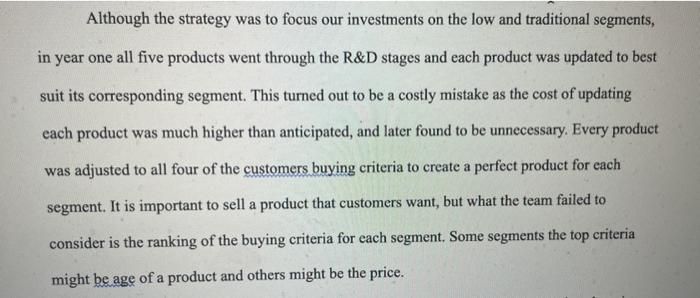
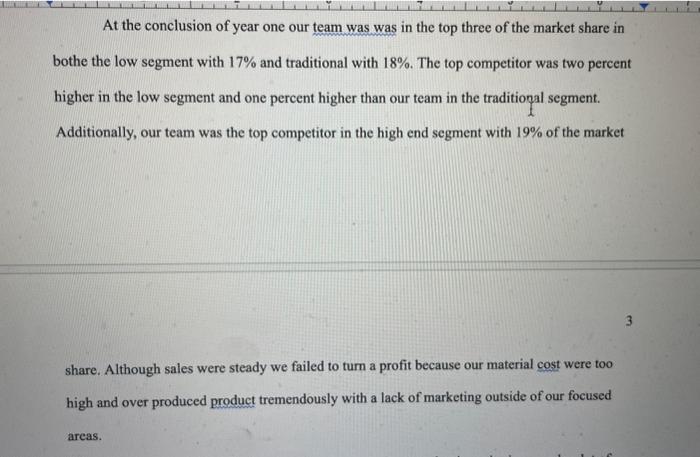
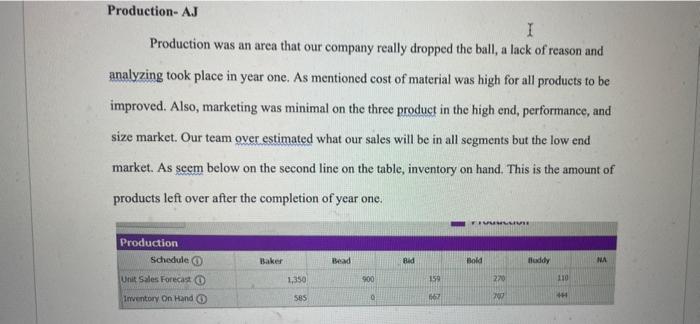
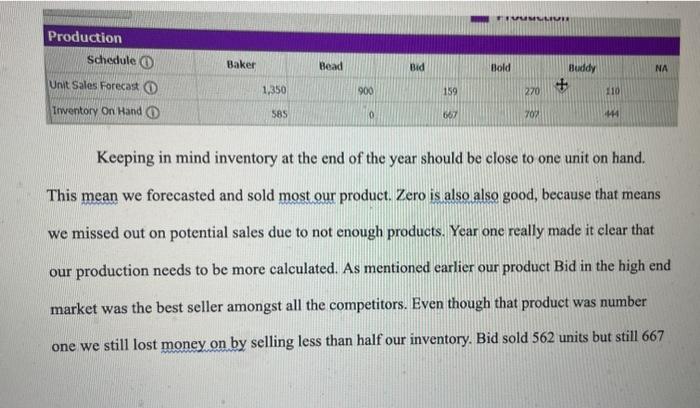
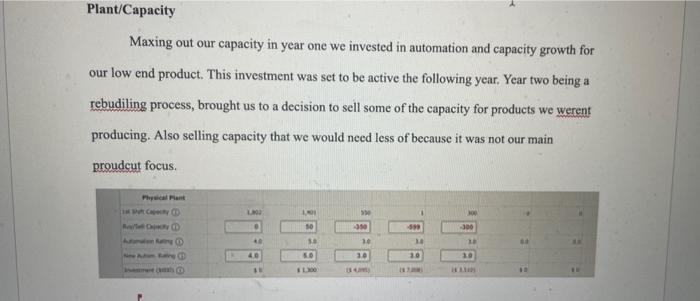
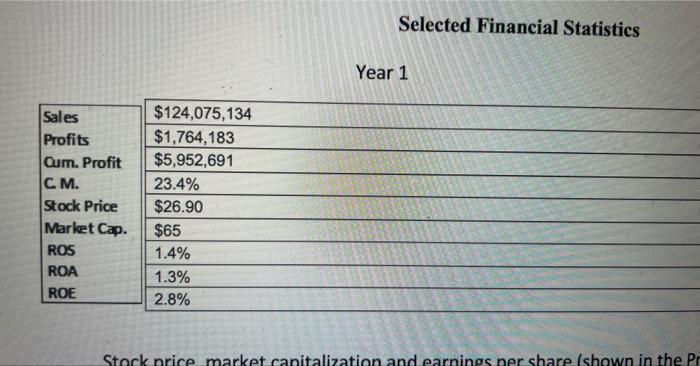
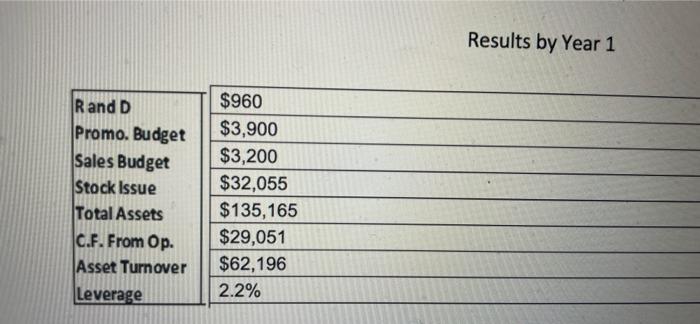
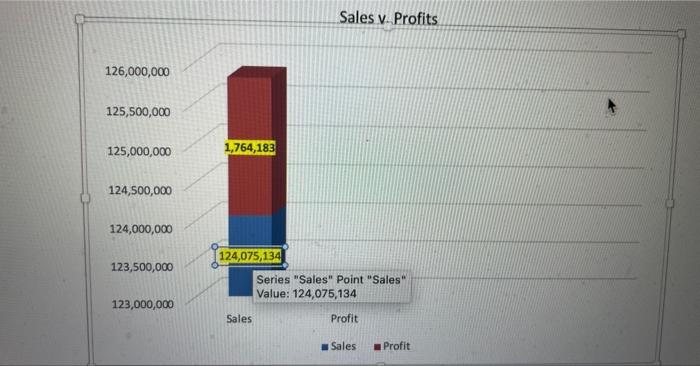
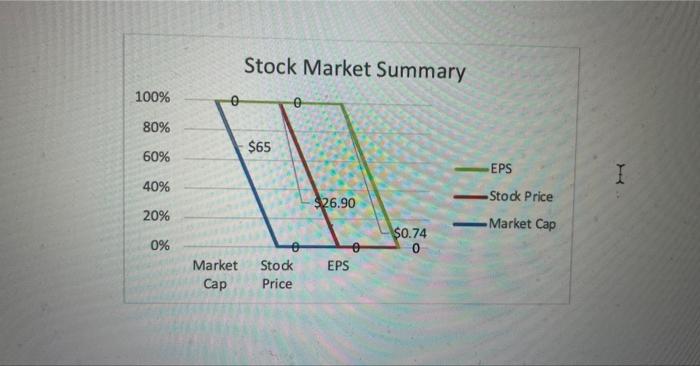
5 Market Share C142621 Cash Flow Statement Finance The Management Team at ACME is pleased to announce the results of the 20xx fiscal year, which again lead the industry in nearly every financial category. With an average X.X\% segment growth, ACME was able to turn $X.X in profits, which exceeds previous years by nearly $X.X, and our highest sales ever at $X.X, exceeding the previous year for the fourth straight year. Selected Financial Statistics Stock price, market capitalization and earnings per share (shown in the Profitability Ratios graph below) have trended positively each year since 20xx, demonstrating the ability and efficiency of the management team in generating wealth. ACME is the only company in the industry that can boast such performance. For the first time, we have seen our market capitalization over $X.X and stock price exceeding $X.X, an ACME first. Sales and profits significantly increased over 20xx with the aforementioned X.X% average segment growth leading into 201xx In addition, the increase in market share in Traditional, Low End, and Performance outweighed the decrease in market share for High End and Size Segments. Plans continue to formulate an answer to increase market share in High End and Size in lieu of heavy competition in both markets. ACME found itself in a unique position of having sufficient free cash to fund nearly $XXX in dividends without having to sell stock or bring on current or long-term debt. We are pleased to continue our mission of providing increasing value to shareholders at the highest rate in the Stock price, market capitalization and earnings per share (shown in the Profitability Ratios graph below) have trended positively each year since 20xx, demonstrating the ability and efficiency of the management team in generating wealth. ACME is the only company in the industry that can boast such performance. For the first time, we have seen our market capitalization over $X.X and stock price exceeding $X.X, an ACME first. Sales and profits significantly increased over 20xX with the aforementioned X.X% average segment growth leading into 201xx In addition, the increase in market share in Traditional, Low End, and Performance outweighed the decrease in market share for High End and Size Segments. Plans continue to formulate an answer to increase market share in High End and Size in lieu of heavy competition in both markets. ACME found itself in a unique position of having sufficient free cash to fund nearly $XX.X in dividends without having to sell stock or bring on current or long-term debt. We are pleased to continue our mission of providing increasing value to shareholders at the highest rate in the industry. The overall contribution margin increased by X.X points from X.X% in 20xX to X.X% this year. Although this is a slight increase, the low contribution margin from our new product E, at X.X%, was offset by our increase in contribution margin of nearly every other product. Twentytwenty results are expected to be at nearly X.X%. Our TQM strategy changed material and labor costs by X.X\% and X.X\%, respectively, which explains the change in contribution margins for most products. ACME Executive Summary - 201xx As mentioned in 20xx, Asset Turnover changed by X.X points. This was due to the sales of roduct C and the change of fixed assets seen by the (purchase, sales) of $X.X in plant and equipment. Leverage changed due to the change in debt of $X.X. - Recommendation 1 - Recommendation 2 - Recommendation 3 Sales v. Profits (in Millions) Profitability Ratios Stock Market Summary The early stages of research and development our company spent a large amount of money in this department. In year one, the strategy was to target the traditionalyand market by making those products the ones that had the majority of the investments in R\&D, marketing, and production. The purpose of this was to be a top seller in a more narrow market instead of over extending the business in too many areas. Upon researching each segment, it was seen that the low end and traditional market was a large percentage of the total industry. Low end had 39.3% of the total industry with 11.7% segment growth for the following year. Traditional had 32.4% with a 9.2% segment growth for the following year. The two segments combined for 71% of the industry. Although the growth rate was smaller for the individual segments the percentage of the total market brought the team to the decision of making these two our focus. Although the strategy was to focus our investments on the low and traditional segments, in year one all five products went through the R\&D stages and each product was updated to best suit its corresponding segment. This turned out to be a costly mistake as the cost of updating each product was much higher than anticipated, and later found to be unnecessary. Every product was adjusted to all four of the customers buying criteria to create a perfect product for each segment. It is important to sell a product that customers want, but what the team failed to consider is the ranking of the buying criteria for each segment. Some segments the top criteria might be age of a product and others might be the price. At the conclusion of year one our team was was in the top three of the market share in bothe the low segment with 17% and traditional with 18%. The top competitor was two percent higher in the low segment and one percent higher than our team in the traditional segment. Additionally, our team was the top competitor in the high end segment with 19% of the market 3 share. Although sales were steady we failed to turn a profit because our material cost were too high and over produced product tremendously with a lack of marketing outside of our focused areas. In year two our products still fell inline with customers buying criteria changes in the previous year. No changes were made in the R\&D department because it was unnecessary to change products that already aligned almost perfectly in each segment. The only risk we seen to this was the age of products, but the few products affected didnt age out until the end of the year. Marketing-Florian For the marketing section, we mostly focused on our traditional, and high-end products to reach our target audience. We decided to sell our traditional and high-end products (Baker \& Bid) close to the highest price recommended by the buying criteria. Since customers generally expect prices to drop each year, we also decided to sell our entire portfolio at an average to premium, while keeping in mind the buying criteria. We initially thought that by setting high prices, we could lower them in subsequent rounds to meet customer expectations. We expected to make high revenues from the first year, so our marketiry strategy was based on advertising products that were generating the most money. Focusing on our main products, we spent most of our promo budget on our traditional and high-end products. We wanted our customers to be aware of our products since we are new to the market (round 1). Even though we are aware that promo-budget is costly, knowing the importance of customer awareness has motivated us not to save money on the promotion of our traditional and high-end products. We have tried to find the perfect balance between promo-budget and customer awareness to maximize awareness in a costly effective manner. Our marketing decisions have resulted in dominating market shares for our main products: 18% for the traditional, and 19% for the high-end. Since we invested a lot in the marketing of these products, we have raised customer awareness, which has immediately increased our sales in the first round. On the other hand, our competitors have taken advantage of our low marketing for our other products. As we have been successful in building consumer awareness of our core products, we may need to reduce our promotional budget for these and focus on the other segments to gain market share. Production was an area that our company really dropped the ball, a lack of reason and analyzing took place in year one. As mentioned cost of material was high for all products to be improved. Also, marketing was minimal on the three product in the high end, performance, and size market. Our team over estimated what our sales will be in all segments but the low end market. As seem below on the second line on the table, inventory on hand. This is the amount of products left over after the completion of year one. Keeping in mind inventory at the end of the year should be close to one unit on hand. This mean we forecasted and sold most our product. Zero is also also good, because that means we missed out on potential sales due to not enough products. Year one really made it clear that our production needs to be more calculated. As mentioned earlier our product Bid in the high end market was the best seller amongst all the competitors. Even though that product was number one we still lost money on by selling less than half our inventory. Bid sold 562 units but still 667 units remained. On the other side product Bead in the low end section sold 1,821 units and had 0 units remaining; meaning we missed out on potential sales because the product sold out. For year two our company decided to not produce any extra products for Bid, Bold, and Buddy. These products had more than of its inventory from the previous year. Instead we invested in marketing to get these products off the shelves. Also, to narrow our focus we decided to retire the product Bold, as it was not doing well. This was not going to be final until all or a majority of the product was sold at full price. Not producing any product in these three areas allowed us to put funds elsewhere and recoup from the financial loss in the previous year. Plant/Capacity Maxing out our capacity in year one we invested in automation and capacity growth for our low end product. This investment was set to be active the following year. Year two being a rebudiling process, brought us to a decision to sell some of the capacity for products we werent producing. Also selling capacity that we would need less of because it was not our main proudcut focus. Selected Financial Statistics Year 1 Results by Year 1 Sales v. Profits Stock Market Summary 5 Market Share C142621 Cash Flow Statement Finance The Management Team at ACME is pleased to announce the results of the 20xx fiscal year, which again lead the industry in nearly every financial category. With an average X.X\% segment growth, ACME was able to turn $X.X in profits, which exceeds previous years by nearly $X.X, and our highest sales ever at $X.X, exceeding the previous year for the fourth straight year. Selected Financial Statistics Stock price, market capitalization and earnings per share (shown in the Profitability Ratios graph below) have trended positively each year since 20xx, demonstrating the ability and efficiency of the management team in generating wealth. ACME is the only company in the industry that can boast such performance. For the first time, we have seen our market capitalization over $X.X and stock price exceeding $X.X, an ACME first. Sales and profits significantly increased over 20xx with the aforementioned X.X% average segment growth leading into 201xx In addition, the increase in market share in Traditional, Low End, and Performance outweighed the decrease in market share for High End and Size Segments. Plans continue to formulate an answer to increase market share in High End and Size in lieu of heavy competition in both markets. ACME found itself in a unique position of having sufficient free cash to fund nearly $XXX in dividends without having to sell stock or bring on current or long-term debt. We are pleased to continue our mission of providing increasing value to shareholders at the highest rate in the Stock price, market capitalization and earnings per share (shown in the Profitability Ratios graph below) have trended positively each year since 20xx, demonstrating the ability and efficiency of the management team in generating wealth. ACME is the only company in the industry that can boast such performance. For the first time, we have seen our market capitalization over $X.X and stock price exceeding $X.X, an ACME first. Sales and profits significantly increased over 20xX with the aforementioned X.X% average segment growth leading into 201xx In addition, the increase in market share in Traditional, Low End, and Performance outweighed the decrease in market share for High End and Size Segments. Plans continue to formulate an answer to increase market share in High End and Size in lieu of heavy competition in both markets. ACME found itself in a unique position of having sufficient free cash to fund nearly $XX.X in dividends without having to sell stock or bring on current or long-term debt. We are pleased to continue our mission of providing increasing value to shareholders at the highest rate in the industry. The overall contribution margin increased by X.X points from X.X% in 20xX to X.X% this year. Although this is a slight increase, the low contribution margin from our new product E, at X.X%, was offset by our increase in contribution margin of nearly every other product. Twentytwenty results are expected to be at nearly X.X%. Our TQM strategy changed material and labor costs by X.X\% and X.X\%, respectively, which explains the change in contribution margins for most products. ACME Executive Summary - 201xx As mentioned in 20xx, Asset Turnover changed by X.X points. This was due to the sales of roduct C and the change of fixed assets seen by the (purchase, sales) of $X.X in plant and equipment. Leverage changed due to the change in debt of $X.X. - Recommendation 1 - Recommendation 2 - Recommendation 3 Sales v. Profits (in Millions) Profitability Ratios Stock Market Summary The early stages of research and development our company spent a large amount of money in this department. In year one, the strategy was to target the traditionalyand market by making those products the ones that had the majority of the investments in R\&D, marketing, and production. The purpose of this was to be a top seller in a more narrow market instead of over extending the business in too many areas. Upon researching each segment, it was seen that the low end and traditional market was a large percentage of the total industry. Low end had 39.3% of the total industry with 11.7% segment growth for the following year. Traditional had 32.4% with a 9.2% segment growth for the following year. The two segments combined for 71% of the industry. Although the growth rate was smaller for the individual segments the percentage of the total market brought the team to the decision of making these two our focus. Although the strategy was to focus our investments on the low and traditional segments, in year one all five products went through the R\&D stages and each product was updated to best suit its corresponding segment. This turned out to be a costly mistake as the cost of updating each product was much higher than anticipated, and later found to be unnecessary. Every product was adjusted to all four of the customers buying criteria to create a perfect product for each segment. It is important to sell a product that customers want, but what the team failed to consider is the ranking of the buying criteria for each segment. Some segments the top criteria might be age of a product and others might be the price. At the conclusion of year one our team was was in the top three of the market share in bothe the low segment with 17% and traditional with 18%. The top competitor was two percent higher in the low segment and one percent higher than our team in the traditional segment. Additionally, our team was the top competitor in the high end segment with 19% of the market 3 share. Although sales were steady we failed to turn a profit because our material cost were too high and over produced product tremendously with a lack of marketing outside of our focused areas. In year two our products still fell inline with customers buying criteria changes in the previous year. No changes were made in the R\&D department because it was unnecessary to change products that already aligned almost perfectly in each segment. The only risk we seen to this was the age of products, but the few products affected didnt age out until the end of the year. Marketing-Florian For the marketing section, we mostly focused on our traditional, and high-end products to reach our target audience. We decided to sell our traditional and high-end products (Baker \& Bid) close to the highest price recommended by the buying criteria. Since customers generally expect prices to drop each year, we also decided to sell our entire portfolio at an average to premium, while keeping in mind the buying criteria. We initially thought that by setting high prices, we could lower them in subsequent rounds to meet customer expectations. We expected to make high revenues from the first year, so our marketiry strategy was based on advertising products that were generating the most money. Focusing on our main products, we spent most of our promo budget on our traditional and high-end products. We wanted our customers to be aware of our products since we are new to the market (round 1). Even though we are aware that promo-budget is costly, knowing the importance of customer awareness has motivated us not to save money on the promotion of our traditional and high-end products. We have tried to find the perfect balance between promo-budget and customer awareness to maximize awareness in a costly effective manner. Our marketing decisions have resulted in dominating market shares for our main products: 18% for the traditional, and 19% for the high-end. Since we invested a lot in the marketing of these products, we have raised customer awareness, which has immediately increased our sales in the first round. On the other hand, our competitors have taken advantage of our low marketing for our other products. As we have been successful in building consumer awareness of our core products, we may need to reduce our promotional budget for these and focus on the other segments to gain market share. Production was an area that our company really dropped the ball, a lack of reason and analyzing took place in year one. As mentioned cost of material was high for all products to be improved. Also, marketing was minimal on the three product in the high end, performance, and size market. Our team over estimated what our sales will be in all segments but the low end market. As seem below on the second line on the table, inventory on hand. This is the amount of products left over after the completion of year one. Keeping in mind inventory at the end of the year should be close to one unit on hand. This mean we forecasted and sold most our product. Zero is also also good, because that means we missed out on potential sales due to not enough products. Year one really made it clear that our production needs to be more calculated. As mentioned earlier our product Bid in the high end market was the best seller amongst all the competitors. Even though that product was number one we still lost money on by selling less than half our inventory. Bid sold 562 units but still 667 units remained. On the other side product Bead in the low end section sold 1,821 units and had 0 units remaining; meaning we missed out on potential sales because the product sold out. For year two our company decided to not produce any extra products for Bid, Bold, and Buddy. These products had more than of its inventory from the previous year. Instead we invested in marketing to get these products off the shelves. Also, to narrow our focus we decided to retire the product Bold, as it was not doing well. This was not going to be final until all or a majority of the product was sold at full price. Not producing any product in these three areas allowed us to put funds elsewhere and recoup from the financial loss in the previous year. Plant/Capacity Maxing out our capacity in year one we invested in automation and capacity growth for our low end product. This investment was set to be active the following year. Year two being a rebudiling process, brought us to a decision to sell some of the capacity for products we werent producing. Also selling capacity that we would need less of because it was not our main proudcut focus. Selected Financial Statistics Year 1 Results by Year 1 Sales v. Profits Stock Market Summary