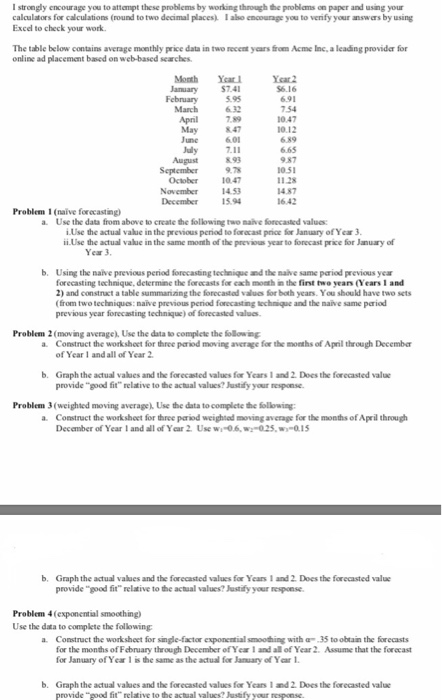
I strongly encourage you to attampt these problems by working through the problams on paper and using your calculators for calculations (round to two decimal places) I ao encourage you to verify your answers by using Excel to check your work The table below contains average monthly price data in two recent years from Acme Inc, a leading provider for online ad placement based on web-based searches. Month Yarl January$741 5.95 6.16 6.91 754 1047 10.12 February March 7.89 847 June July 7.11 893 6.65 987 10.51 1128 14.87 642 October1047 November 1453 December 15.94 Problem 1 (naive forecasting) a. Use the data from above to create the following two maive forecasted values i.Use the actual vakue in the previous period to forocast price for January of Year 3. ii Use the actual value in the same month of the previous year to forecast price for January of b. Using the naive previous period forecasting techniqu.d the naive same Pod previous year forecasting tochnique, determine the forecasts for each mosh in the first two years (Years 1 and 2) and constract a table summaniang the forecastod values for both years. You shoukd have two sets (from two techniques: naive previous period forecasting technique and the maive same pariod previous year forecasting technique) of forecasted values. Problem 2(moving average),Use the data to complete the following a. Constract the workshoct for three pariod moving average for the months of April through December of Year 1 and all of Year 2 b. Graph the actual values and the forecasted values for Years 1 and 2 Does the forecasted value provide "good fit" relative to the actual values? Justify your response Problem 3 (weighted moving average). Use the data to complete the folowing Construct the worksheet for December of Year 1 and all of Year 2 pariod weighted moving average for the months of April through a. ree Usew 06w-025,-0.15 b. Graph the actual values and the forecasted values for Years 1 and 2 Does the forecasted value provide "good fit" relative to the actual values? Justity your response Problem 4(exponential smoothing) Use the data to complete the following a. Construct the workshect for single-factor exponential smoothing with 35 to obtain the forecasts for the months of February through December of Year I and all of Year2. Assume that the forecast for January ofYear 1e same as the actual for January of YarL b. Graph the actual values and the forecasted values for Years 1 and 2 Does the forecasted valux provide "good fit relative to the actual values? Justify your response. I strongly encourage you to attampt these problems by working through the problams on paper and using your calculators for calculations (round to two decimal places) I ao encourage you to verify your answers by using Excel to check your work The table below contains average monthly price data in two recent years from Acme Inc, a leading provider for online ad placement based on web-based searches. Month Yarl January$741 5.95 6.16 6.91 754 1047 10.12 February March 7.89 847 June July 7.11 893 6.65 987 10.51 1128 14.87 642 October1047 November 1453 December 15.94 Problem 1 (naive forecasting) a. Use the data from above to create the following two maive forecasted values i.Use the actual vakue in the previous period to forocast price for January of Year 3. ii Use the actual value in the same month of the previous year to forecast price for January of b. Using the naive previous period forecasting techniqu.d the naive same Pod previous year forecasting tochnique, determine the forecasts for each mosh in the first two years (Years 1 and 2) and constract a table summaniang the forecastod values for both years. You shoukd have two sets (from two techniques: naive previous period forecasting technique and the maive same pariod previous year forecasting technique) of forecasted values. Problem 2(moving average),Use the data to complete the following a. Constract the workshoct for three pariod moving average for the months of April through December of Year 1 and all of Year 2 b. Graph the actual values and the forecasted values for Years 1 and 2 Does the forecasted value provide "good fit" relative to the actual values? Justify your response Problem 3 (weighted moving average). Use the data to complete the folowing Construct the worksheet for December of Year 1 and all of Year 2 pariod weighted moving average for the months of April through a. ree Usew 06w-025,-0.15 b. Graph the actual values and the forecasted values for Years 1 and 2 Does the forecasted value provide "good fit" relative to the actual values? Justity your response Problem 4(exponential smoothing) Use the data to complete the following a. Construct the workshect for single-factor exponential smoothing with 35 to obtain the forecasts for the months of February through December of Year I and all of Year2. Assume that the forecast for January ofYear 1e same as the actual for January of YarL b. Graph the actual values and the forecasted values for Years 1 and 2 Does the forecasted valux provide "good fit relative to the actual values? Justify your response