

Answered step by step
Verified Expert Solution
Question
1 Approved Answer
I. Title: Data Visualization Dashboard II. Introduction All graduate accounting course deliverables use the AICPA Foundational Competencies Framework for Aspiring CPAs to assess competencies deemed
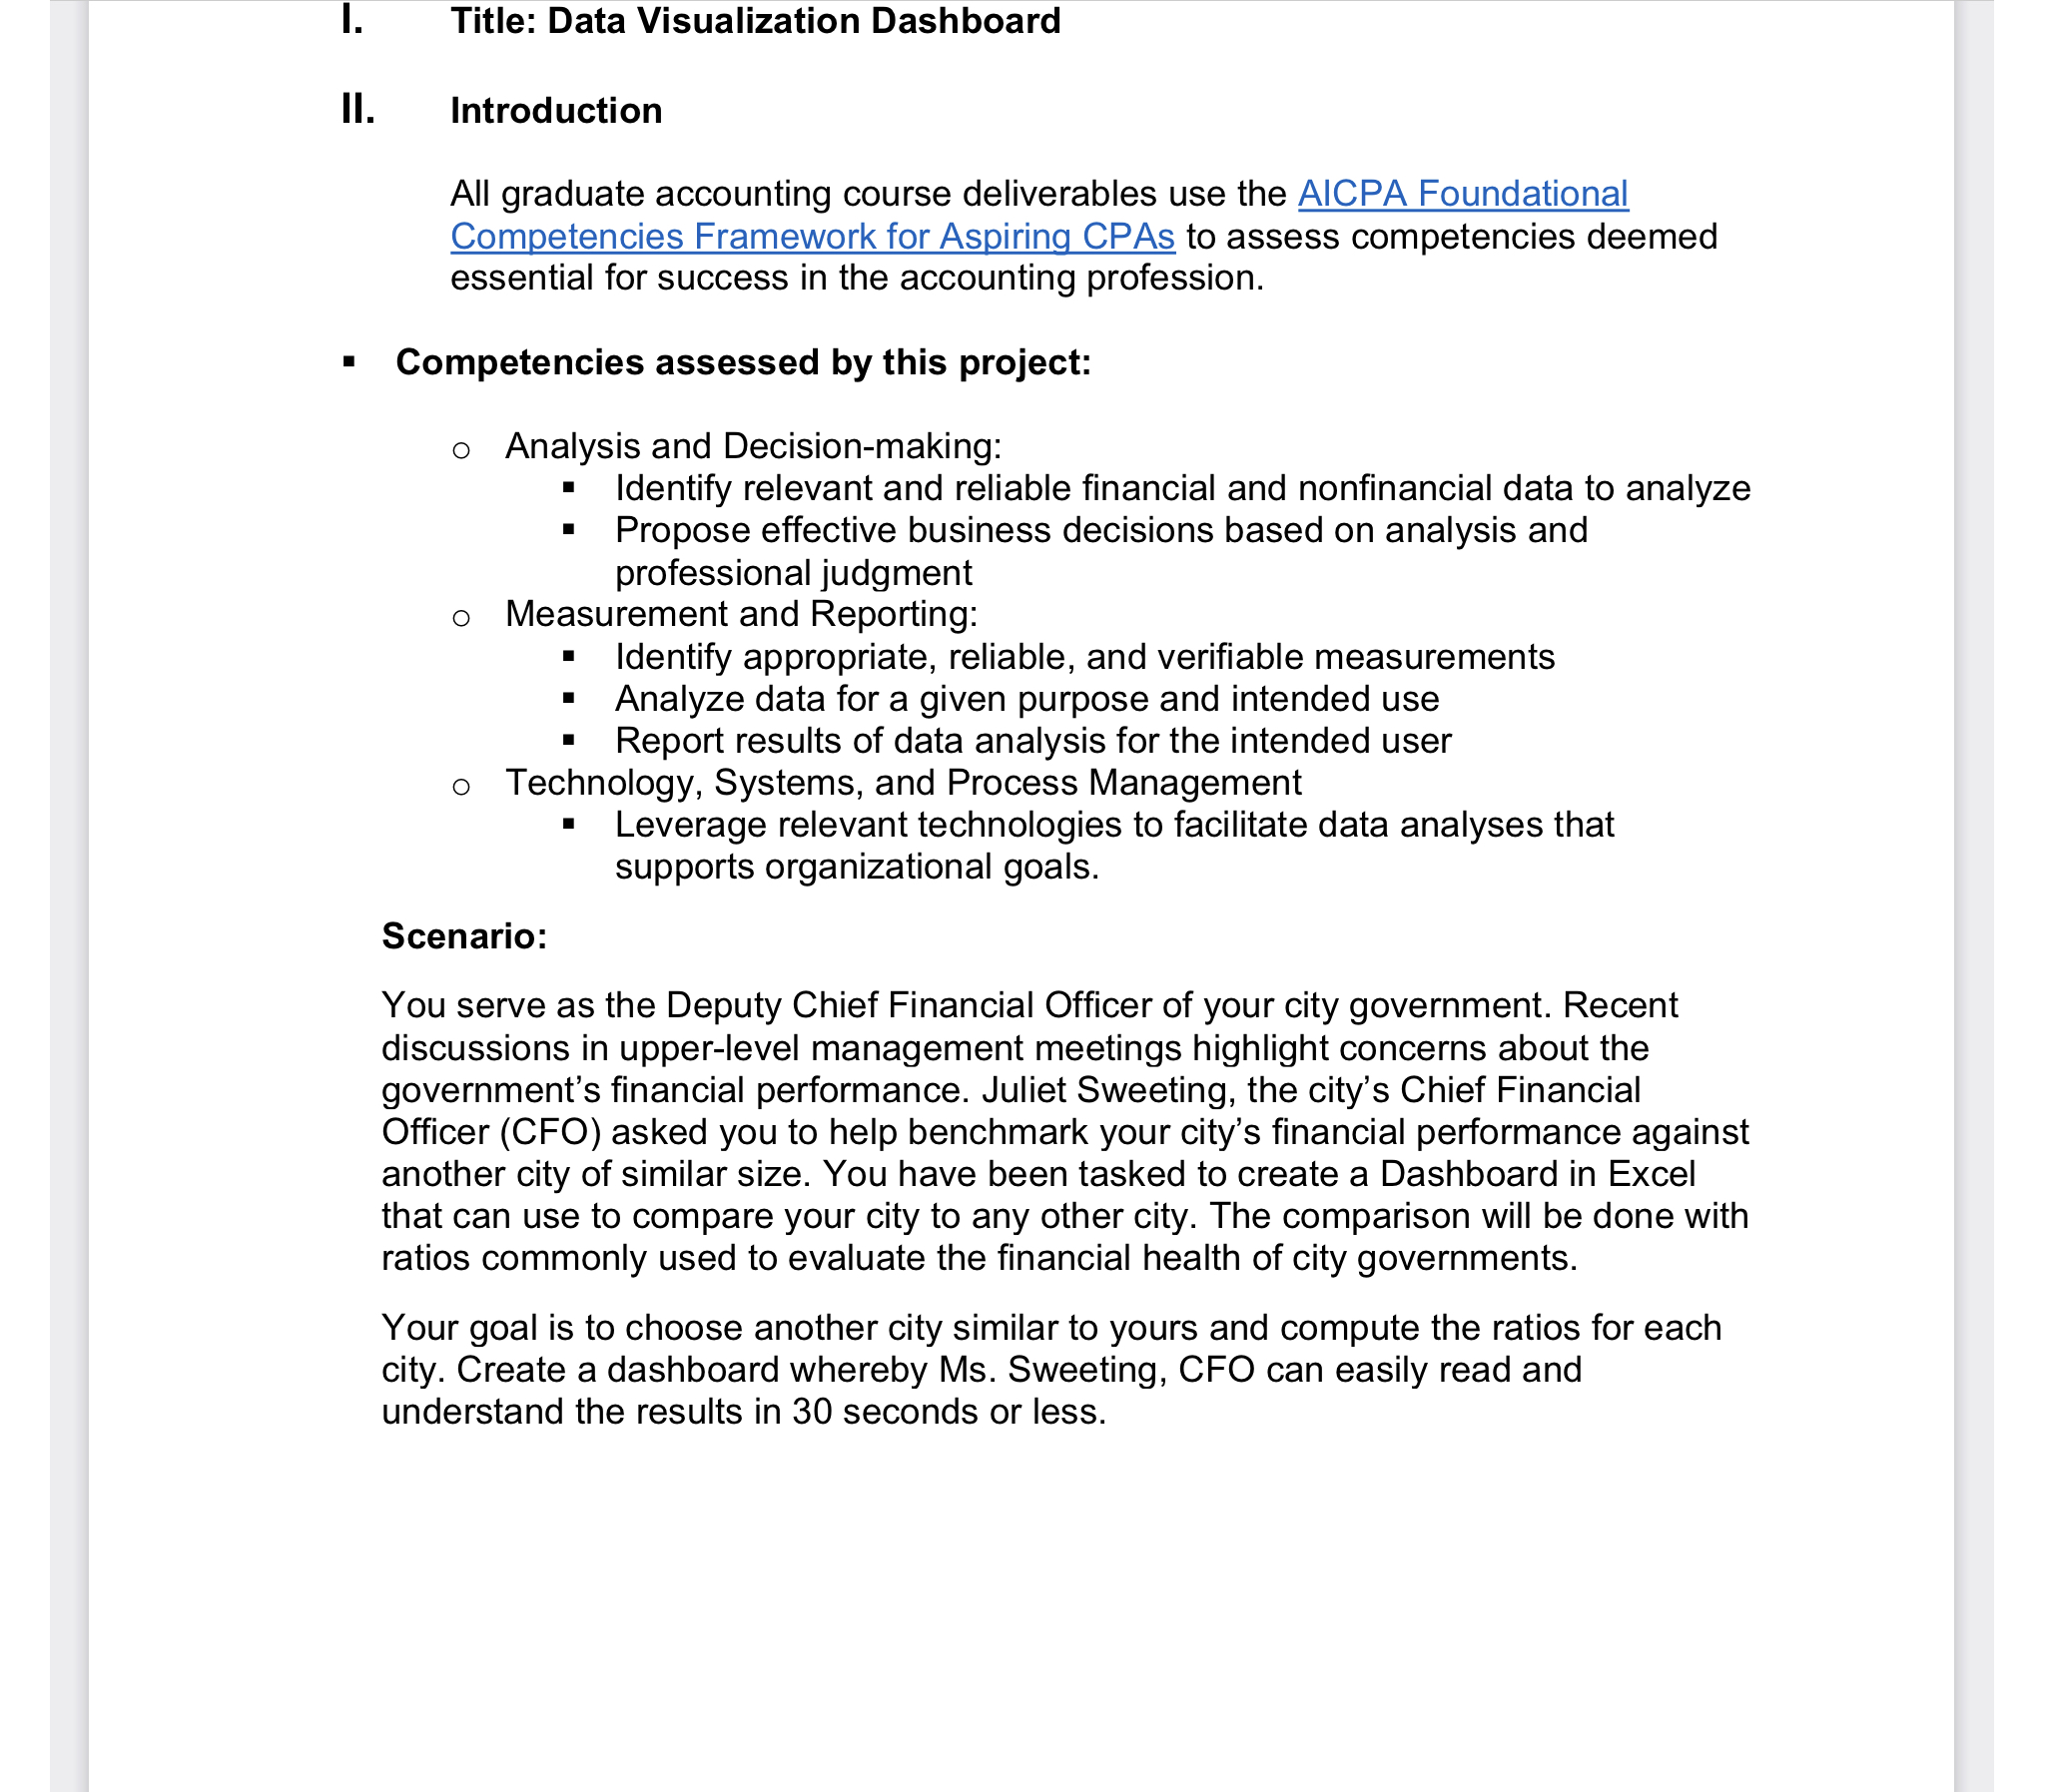
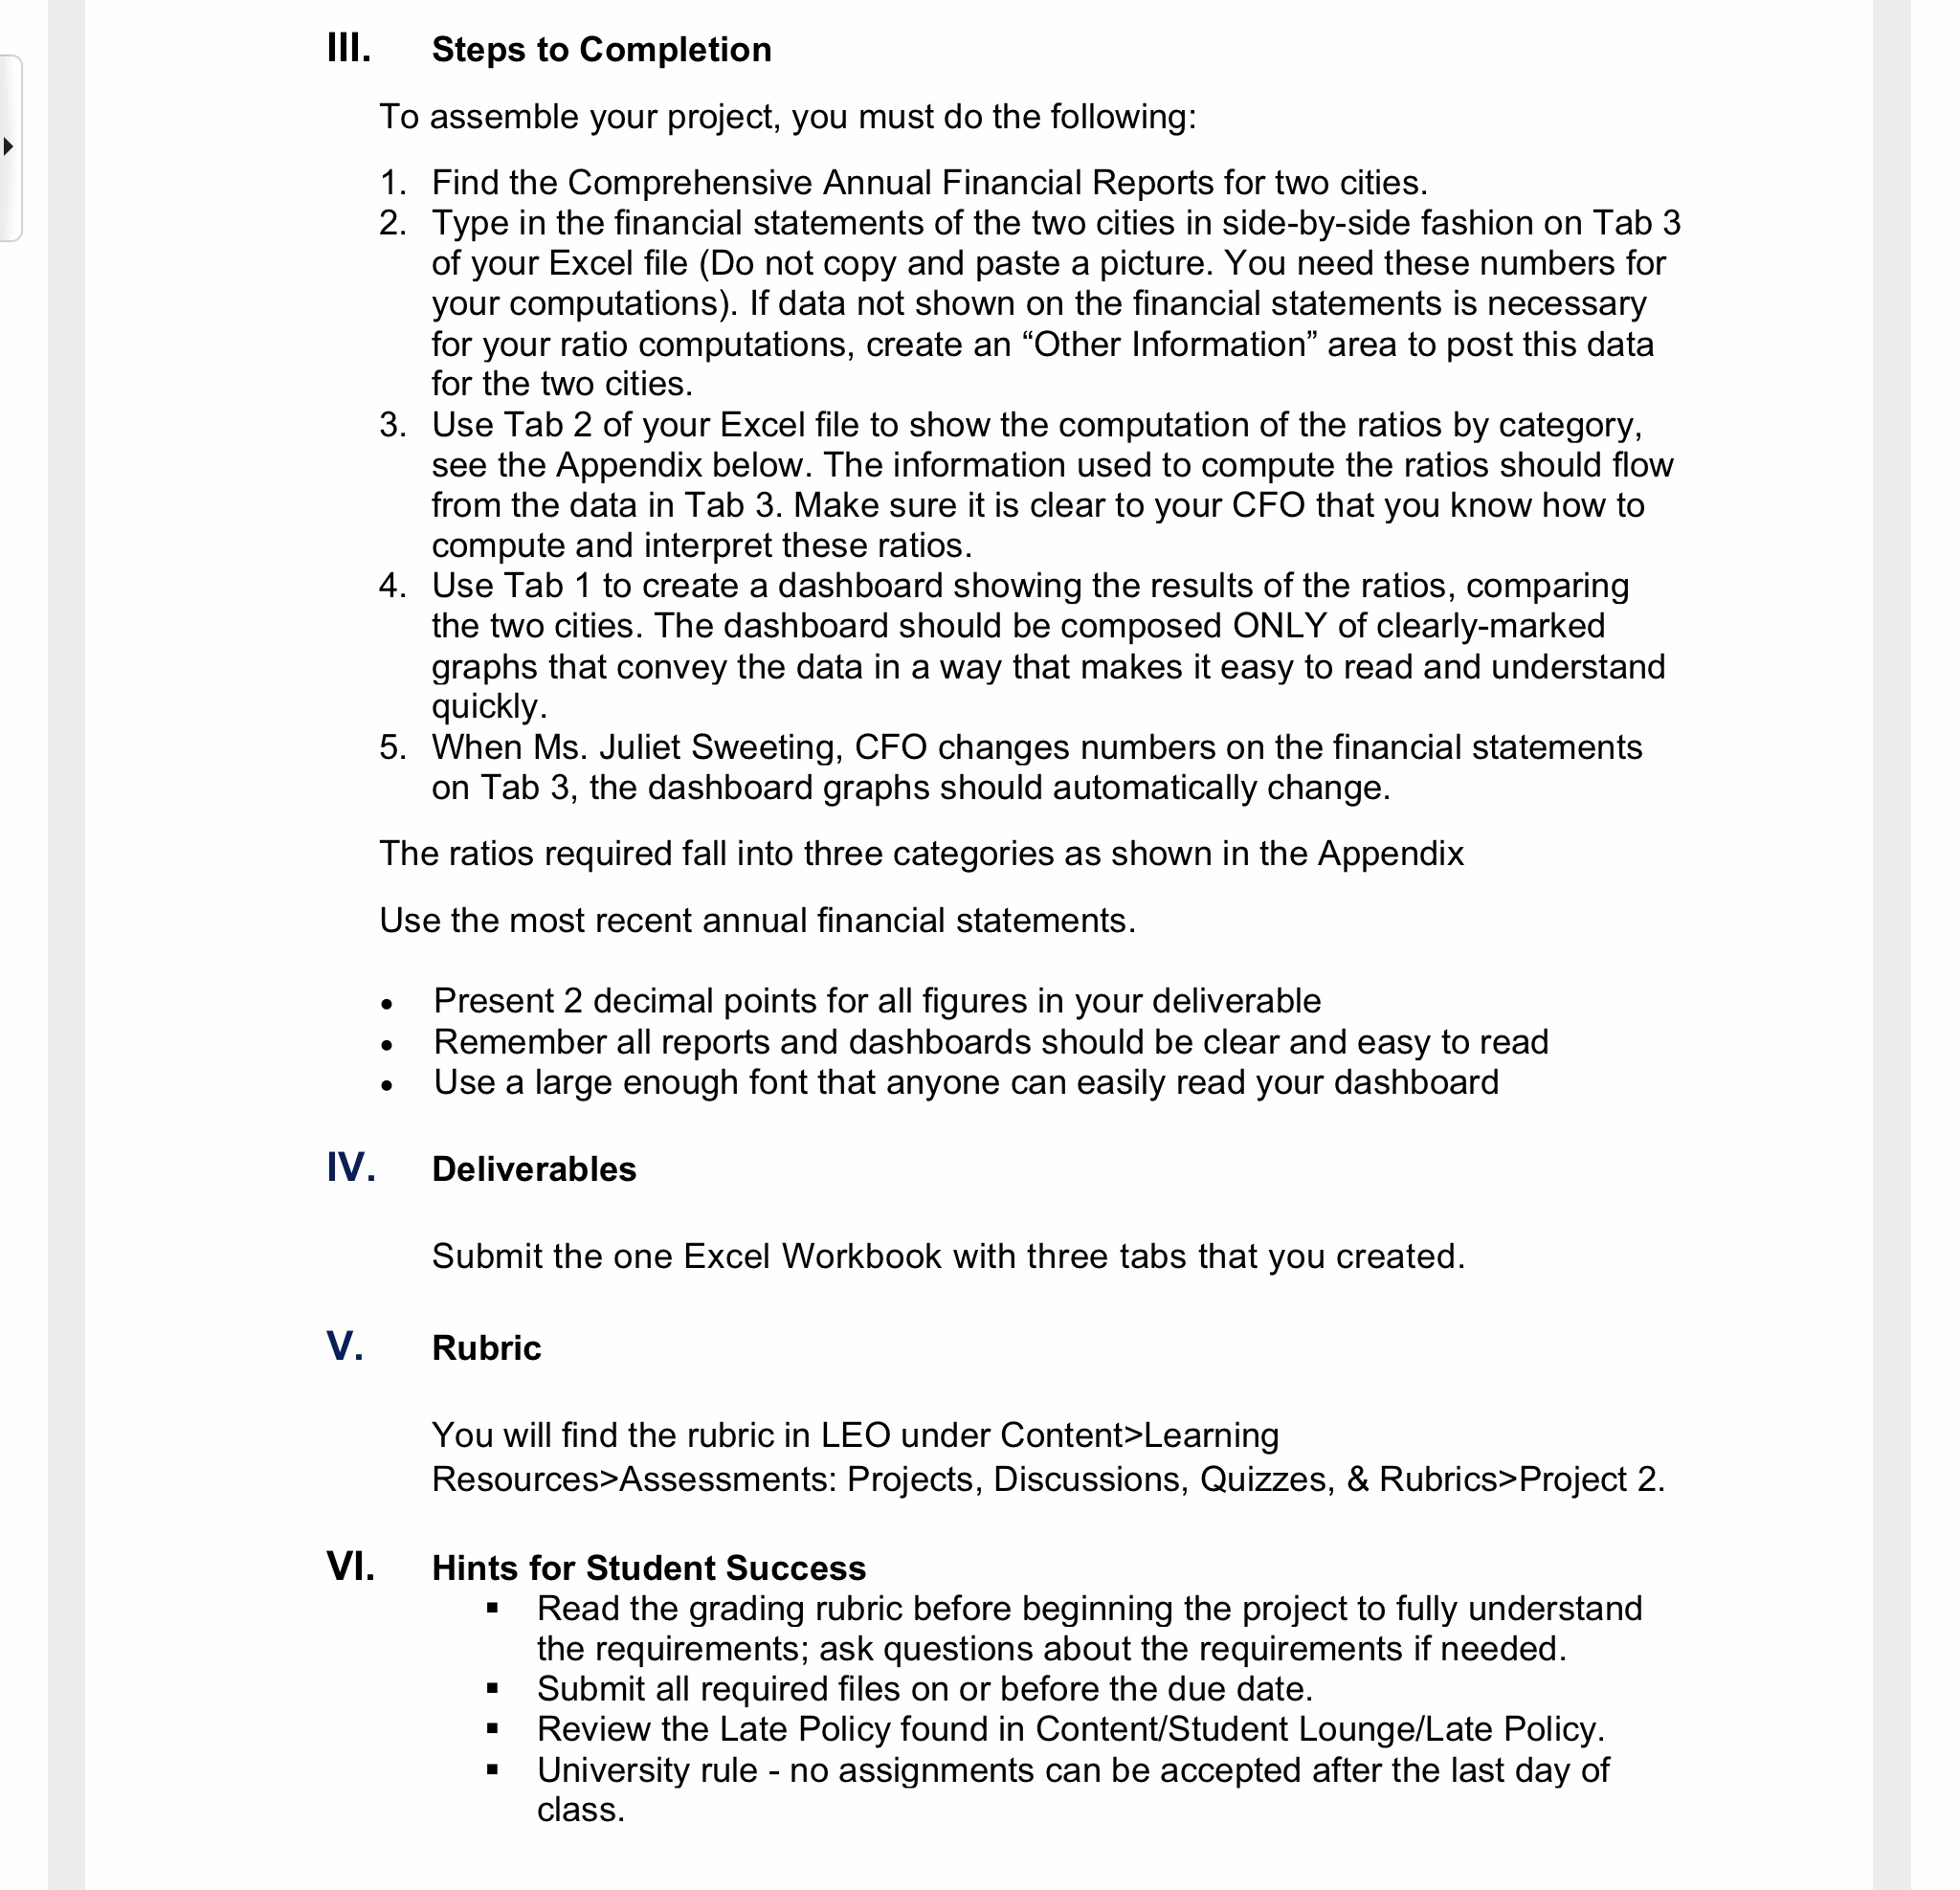
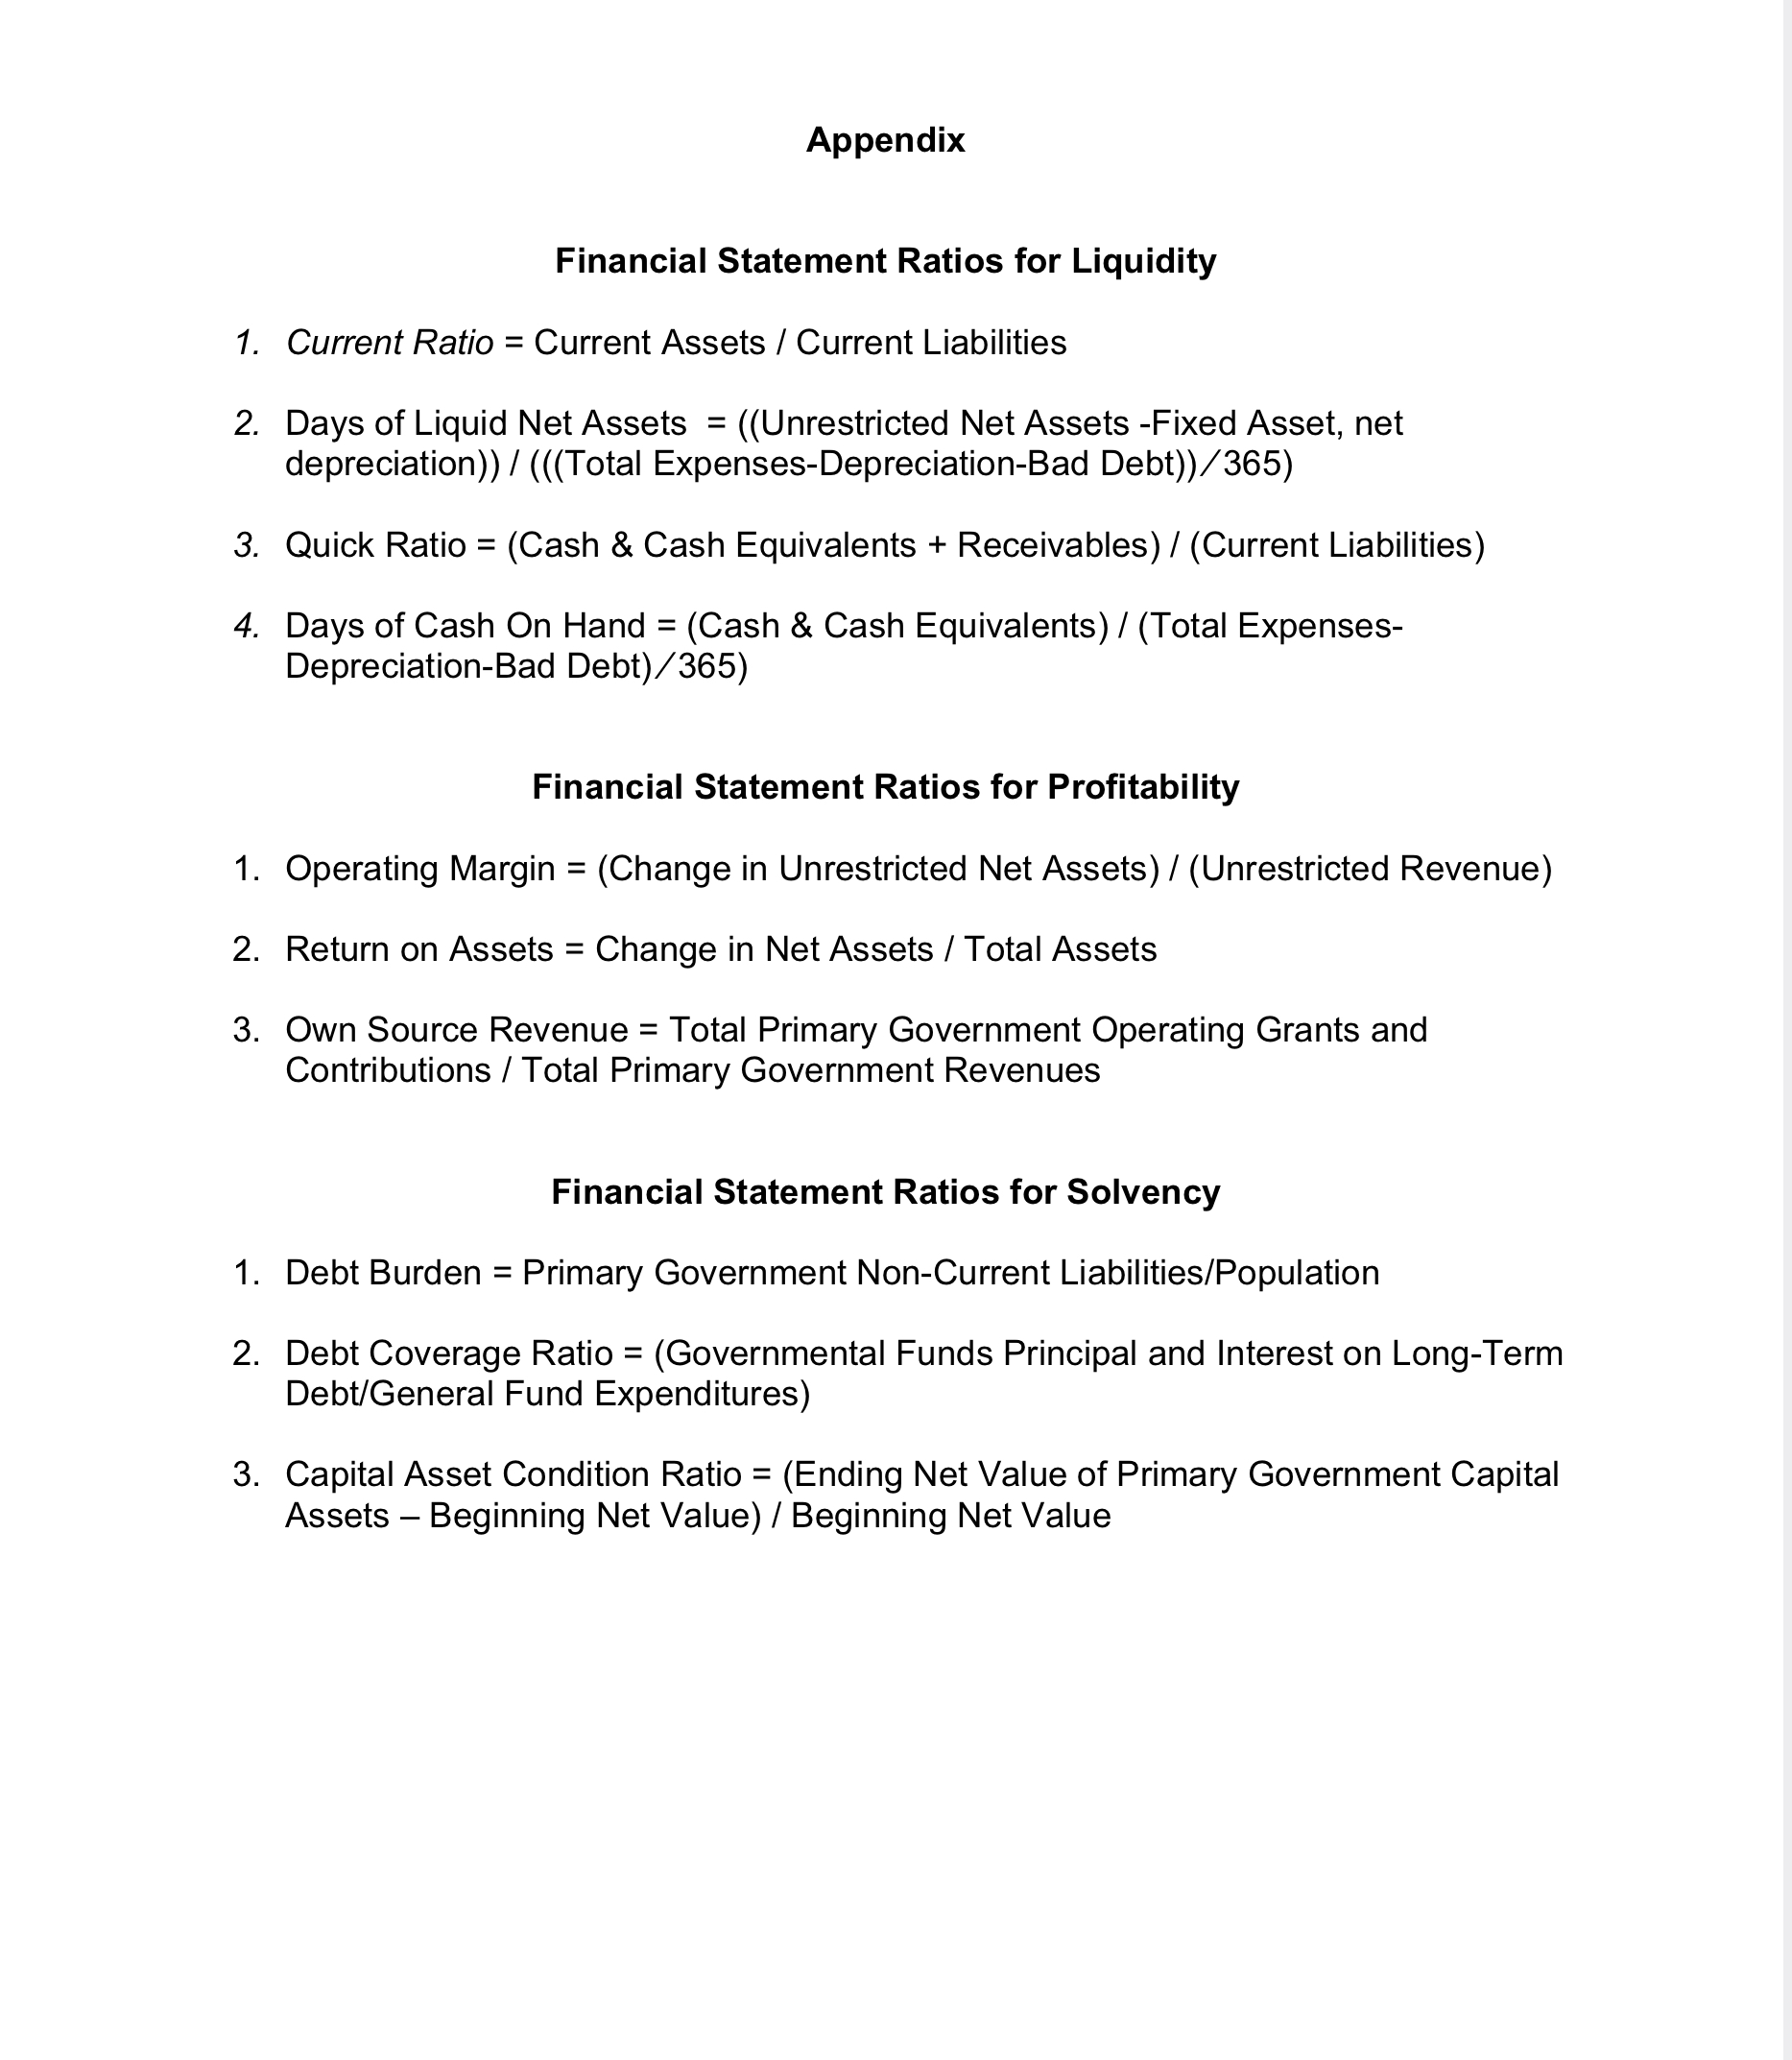 I. Title: Data Visualization Dashboard II. Introduction All graduate accounting course deliverables use the AICPA Foundational Competencies Framework for Aspiring CPAs to assess competencies deemed essential for success in the accounting profession. - Competencies assessed by this project: - Analysis and Decision-making: - Identify relevant and reliable financial and nonfinancial data to analyze - Propose effective business decisions based on analysis and professional judgment - Measurement and Reporting: - Identify appropriate, reliable, and verifiable measurements - Analyze data for a given purpose and intended use - Report results of data analysis for the intended user - Technology, Systems, and Process Management - Leverage relevant technologies to facilitate data analyses that supports organizational goals. Scenario: You serve as the Deputy Chief Financial Officer of your city government. Recent discussions in upper-level management meetings highlight concerns about the government's financial performance. Juliet Sweeting, the city's Chief Financial Officer (CFO) asked you to help benchmark your city's financial performance against another city of similar size. You have been tasked to create a Dashboard in Excel that can use to compare your city to any other city. The comparison will be done with ratios commonly used to evaluate the financial health of city governments. Your goal is to choose another city similar to yours and compute the ratios for each city. Create a dashboard whereby Ms. Sweeting, CFO can easily read and understand the results in 30 seconds or less. III. Steps to Completion To assemble your project, you must do the following: 1. Find the Comprehensive Annual Financial Reports for two cities. 2. Type in the financial statements of the two cities in side-by-side fashion on Tab 3 of your Excel file (Do not copy and paste a picture. You need these numbers for your computations). If data not shown on the financial statements is necessary for your ratio computations, create an "Other Information" area to post this data for the two cities. 3. Use Tab 2 of your Excel file to show the computation of the ratios by category, see the Appendix below. The information used to compute the ratios should flow from the data in Tab 3. Make sure it is clear to your CFO that you know how to compute and interpret these ratios. 4. Use Tab 1 to create a dashboard showing the results of the ratios, comparing the two cities. The dashboard should be composed ONLY of clearly-marked graphs that convey the data in a way that makes it easy to read and understand quickly. 5. When Ms. Juliet Sweeting, CFO changes numbers on the financial statements on Tab 3, the dashboard graphs should automatically change. The ratios required fall into three categories as shown in the Appendix Use the most recent annual financial statements. - Present 2 decimal points for all figures in your deliverable - Remember all reports and dashboards should be clear and easy to read - Use a large enough font that anyone can easily read your dashboard IV. Deliverables Submit the one Excel Workbook with three tabs that you created. V. Rubric You will find the rubric in LEO under Content>Learning Resources>Assessments: Projects, Discussions, Quizzes, \& Rubrics>Project 2. VI. Hints for Student Success - Read the grading rubric before beginning the project to fully understand the requirements; ask questions about the requirements if needed. - Submit all required files on or before the due date. - Review the Late Policy found in Content/Student Lounge/Late Policy. - University rule - no assignments can be accepted after the last day of class. Appendix Financial Statement Ratios for Liquidity 1. Current Ratio = Current Assets / Current Liabilities 2. Days of Liquid Net Assets =(( Unrestricted Net Assets -Fixed Asset, net depreciation ) ) / ((Total Expenses-Depreciation-Bad Debt))/365) 3. Quick Ratio =( Cash & Cash Equivalents + Receivables )/ (Current Liabilities ) 4. Days of Cash On Hand = (Cash \& Cash Equivalents )/ (Total ExpensesDepreciation-Bad Debt)/365) Financial Statement Ratios for Profitability 1. Operating Margin =( Change in Unrestricted Net Assets )/ (Unrestricted Revenue ) 2. Return on Assets = Change in Net Assets / Total Assets 3. Own Source Revenue = Total Primary Government Operating Grants and Contributions / Total Primary Government Revenues Financial Statement Ratios for Solvency 1. Debt Burden = Primary Government Non-Current Liabilities/Population 2. Debt Coverage Ratio =( Governmental Funds Principal and Interest on Long-Term Debt/General Fund Expenditures) 3. Capital Asset Condition Ratio =( Ending Net Value of Primary Government Capital Assets - Beginning Net Value) / Beginning Net Value I. Title: Data Visualization Dashboard II. Introduction All graduate accounting course deliverables use the AICPA Foundational Competencies Framework for Aspiring CPAs to assess competencies deemed essential for success in the accounting profession. - Competencies assessed by this project: - Analysis and Decision-making: - Identify relevant and reliable financial and nonfinancial data to analyze - Propose effective business decisions based on analysis and professional judgment - Measurement and Reporting: - Identify appropriate, reliable, and verifiable measurements - Analyze data for a given purpose and intended use - Report results of data analysis for the intended user - Technology, Systems, and Process Management - Leverage relevant technologies to facilitate data analyses that supports organizational goals. Scenario: You serve as the Deputy Chief Financial Officer of your city government. Recent discussions in upper-level management meetings highlight concerns about the government's financial performance. Juliet Sweeting, the city's Chief Financial Officer (CFO) asked you to help benchmark your city's financial performance against another city of similar size. You have been tasked to create a Dashboard in Excel that can use to compare your city to any other city. The comparison will be done with ratios commonly used to evaluate the financial health of city governments. Your goal is to choose another city similar to yours and compute the ratios for each city. Create a dashboard whereby Ms. Sweeting, CFO can easily read and understand the results in 30 seconds or less. III. Steps to Completion To assemble your project, you must do the following: 1. Find the Comprehensive Annual Financial Reports for two cities. 2. Type in the financial statements of the two cities in side-by-side fashion on Tab 3 of your Excel file (Do not copy and paste a picture. You need these numbers for your computations). If data not shown on the financial statements is necessary for your ratio computations, create an "Other Information" area to post this data for the two cities. 3. Use Tab 2 of your Excel file to show the computation of the ratios by category, see the Appendix below. The information used to compute the ratios should flow from the data in Tab 3. Make sure it is clear to your CFO that you know how to compute and interpret these ratios. 4. Use Tab 1 to create a dashboard showing the results of the ratios, comparing the two cities. The dashboard should be composed ONLY of clearly-marked graphs that convey the data in a way that makes it easy to read and understand quickly. 5. When Ms. Juliet Sweeting, CFO changes numbers on the financial statements on Tab 3, the dashboard graphs should automatically change. The ratios required fall into three categories as shown in the Appendix Use the most recent annual financial statements. - Present 2 decimal points for all figures in your deliverable - Remember all reports and dashboards should be clear and easy to read - Use a large enough font that anyone can easily read your dashboard IV. Deliverables Submit the one Excel Workbook with three tabs that you created. V. Rubric You will find the rubric in LEO under Content>Learning Resources>Assessments: Projects, Discussions, Quizzes, \& Rubrics>Project 2. VI. Hints for Student Success - Read the grading rubric before beginning the project to fully understand the requirements; ask questions about the requirements if needed. - Submit all required files on or before the due date. - Review the Late Policy found in Content/Student Lounge/Late Policy. - University rule - no assignments can be accepted after the last day of class. Appendix Financial Statement Ratios for Liquidity 1. Current Ratio = Current Assets / Current Liabilities 2. Days of Liquid Net Assets =(( Unrestricted Net Assets -Fixed Asset, net depreciation ) ) / ((Total Expenses-Depreciation-Bad Debt))/365) 3. Quick Ratio =( Cash & Cash Equivalents + Receivables )/ (Current Liabilities ) 4. Days of Cash On Hand = (Cash \& Cash Equivalents )/ (Total ExpensesDepreciation-Bad Debt)/365) Financial Statement Ratios for Profitability 1. Operating Margin =( Change in Unrestricted Net Assets )/ (Unrestricted Revenue ) 2. Return on Assets = Change in Net Assets / Total Assets 3. Own Source Revenue = Total Primary Government Operating Grants and Contributions / Total Primary Government Revenues Financial Statement Ratios for Solvency 1. Debt Burden = Primary Government Non-Current Liabilities/Population 2. Debt Coverage Ratio =( Governmental Funds Principal and Interest on Long-Term Debt/General Fund Expenditures) 3. Capital Asset Condition Ratio =( Ending Net Value of Primary Government Capital Assets - Beginning Net Value) / Beginning Net Value
 Step by Step Solution
There are 3 Steps involved in it
Step: 1

Get Instant Access to Expert-Tailored Solutions
See step-by-step solutions with expert insights and AI powered tools for academic success
Step: 2

Step: 3
Ace Your Homework with AI
Get the answers you need in no time with our AI-driven, step-by-step assistance
Get Started
The Little Book Of Common Sense Investing The Only Way To Guarantee Your Fair Share Of Stock Market Returns
Authors: John C. Bogle
1st Edition
1119404509, 978-1119404507