

Answered step by step
Verified Expert Solution
Question
1 Approved Answer
i took so many pictures of this question... nobody should say they cant see it. he Activity-NPV profiles Video Excel Online Structured Activity: NPV profiles
i took so many pictures of this question... nobody should say they cant see it. 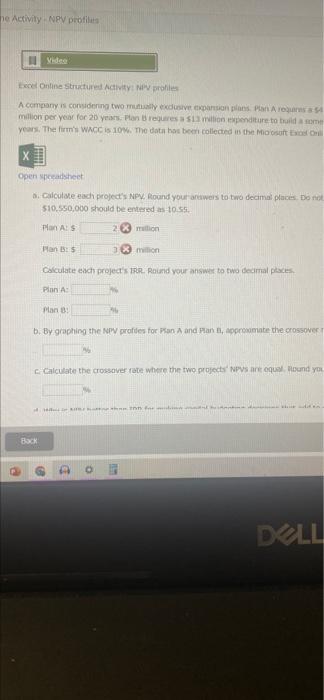
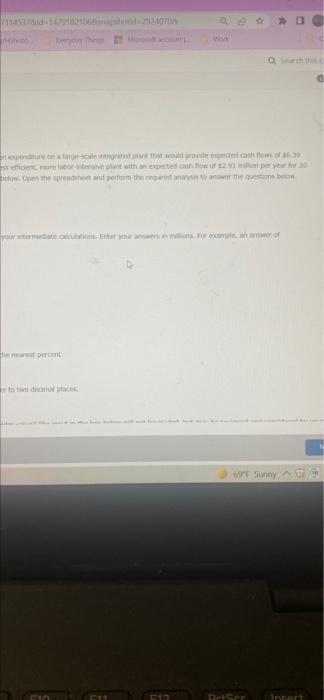
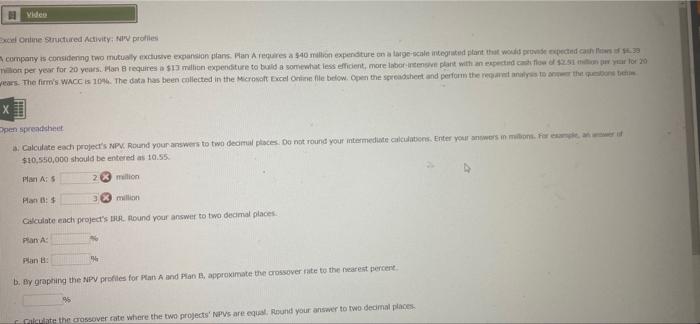
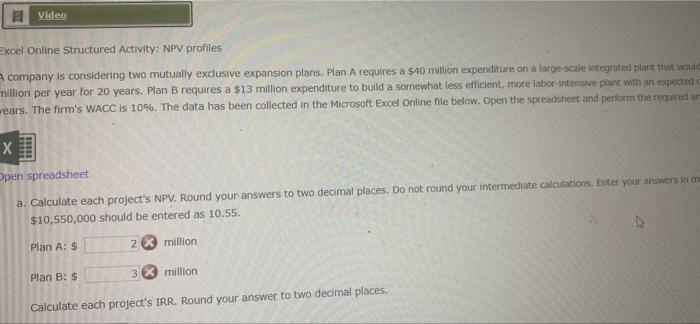
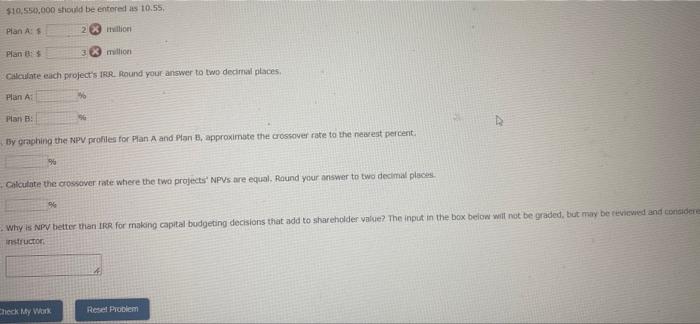
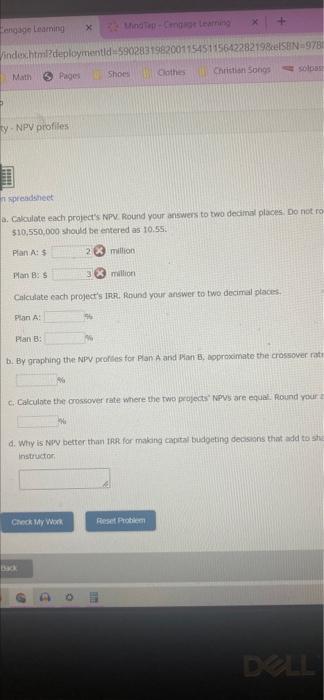
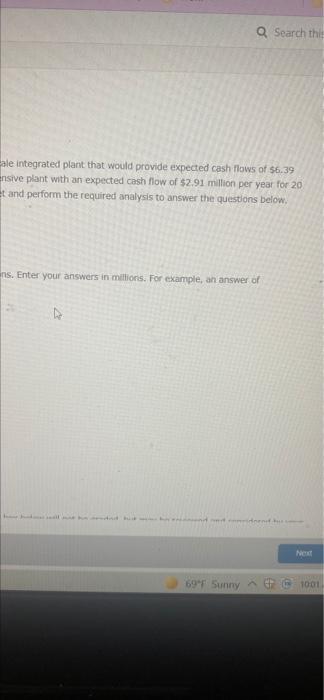
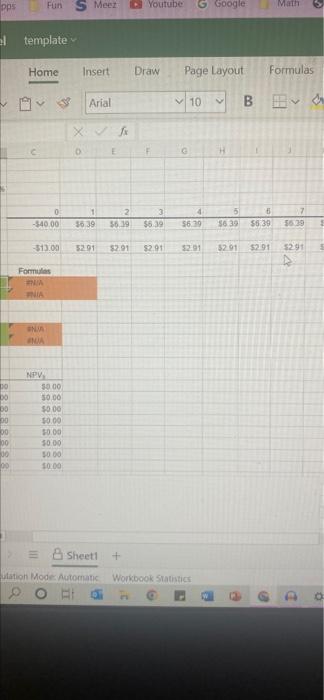
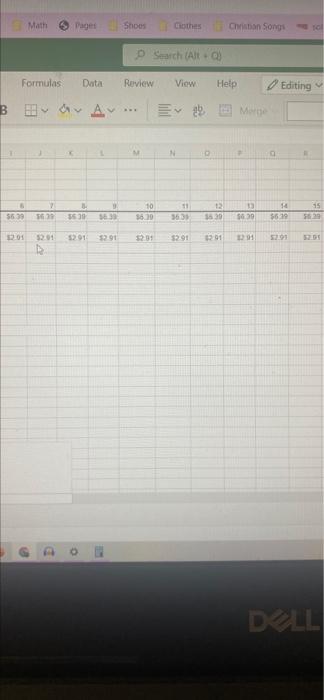
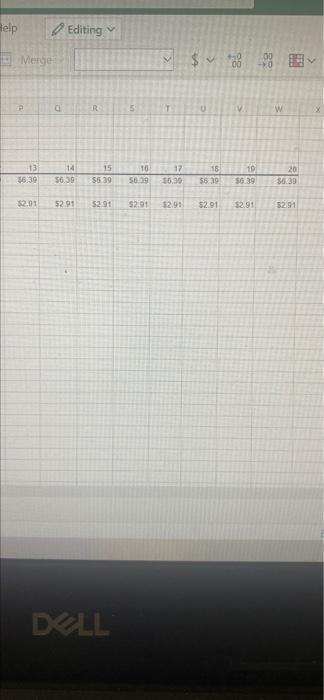
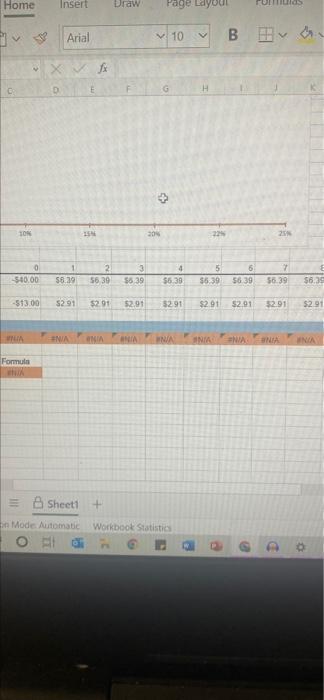
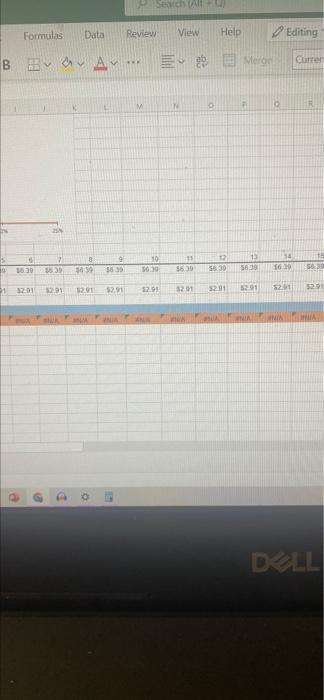
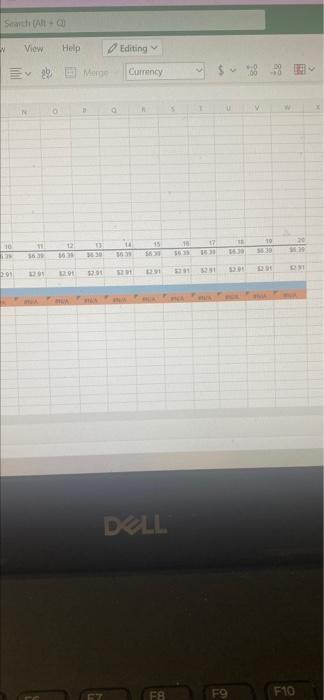
he Activity-NPV profiles Video Excel Online Structured Activity: NPV profiles A company is considering two mutually exclusive expansion plans. Plan A requares a s million per year for 20 years. Plan B requires a $13 million expenditure to build a some years. The firm's WACC is 10%. The data has been collected in the Microsoft Excel Or Open spreadsheet a. Calculate each project's NPV. Round your answers to two decimal places. Do not $10,550,000 should be entered as 10.55. Plan A: S 23 mallion Plan B: S million Calculate each project's IRR. Round your answer to two decimal places. Plan A: Plan B b. By graphing the NPV profiles for Plan A and Plan B, approximate the crossover Calculate the crossover rate where the two projects' NPVS are equal. Round you Kit for m DELL Back CA A 500201120011545115642282188587-970015711453786d-14791821068borld-2243 OLE Quines Chetall Song Trey Thng 2 Wota proties y exclinave expartsson plans. Pan A requires a 540 miun experture in a targe-sce integrated plane that treguares a $12 million expenditure to build a somewhat less efficient, mere labor-intensive plant with an expe e data has been collected in the Microsoft Excet Orone Ne below. Open the spreadsheet and perform the reque Round your answers to two deomal places. Do not round your intermediate calculations. Eitter your arowers red 10.55 on Round your answer to two decimal places for Plan A and Pan nopromate the cover rate to the nearest percent where the two projects NPV are equal. Round your answer to two decimal places DELL F8 F6 H F7 The F9 a F10 F11 71145378id-14791821066napshold-2024070 a Everyday Thing Work 0 on expenditure on a large-scale integrated and that would provide expected cash flows of $6.39 ss efficent, more labor-interove plant with an expected cash flow of $2.91 million per year for 20 below. Open the spreadsheet and perform the requirest analysis to answer the questions below. your intermediate calculations. Enter your answers in millions. For exampin, an answer of the nearest percent 69F Sunny G Incert to two decimal places F10 FUT Priser Video Excel Online Structured Activity: NPV profiles company is considering two mutually exclusive expansion plans. Plan A requires a $40 million expenditure on a large-scale integrated plant that would provide expected cash flow of $4.39 million per year for 20 years. Plan B requires a $13 million expenditure to build a somewhat less efficient, more labor-intensive plant with an expected cash flow of $2.51 milion per year for 20 wears. The firm's WACC is 10%. The data has been collected in the Microsoft Excel Online file below. Open the spreadsheet and perform the requarnt analysis to answer the questions betw Open spreadsheet a. Calculate each project's NPV. Round your answers to two decimal places. Do not round your intermediate calculations. Enter your answers in milions. For example, an awer of $10,550,000 should be entered as 10.55. Plan A: S 2 million Plan B: $ million Calculate each project's RR. Round your answer to two decimal places Plan A Plan B: H b. By graphing the NPV profiles for Plan A and Plan B, approximate the crossover rate to the nearest percent. 96 Calculate the crossover rate where the two projects' NPVs are equal. Round your answer to two decimal places Video Excel Online Structured Activity: NPV profiles A company is considering two mutually exclusive expansion plans. Plan A requires a $40 million expenditure on a large-scale integrated plant that would million per year for 20 years. Plan B requires a $13 million expenditure to build a somewhat less efficient, more labor-intensive plant with an expected c wears. The firm's WACC is 10%. The data has been collected in the Microsoft Excel Online file below. Open the spreadsheet and perform the required am X Open spreadsheet a. Calculate each project's NPV. Round your answers to two decimal places. Do not round your intermediate calculations. Enter your answers in mi $10,550,000 should be entered as 10.55. Plan A: $ 2 X million Plan B: $ 3 million Calculate each project's IRR. Round your answer to two decimal places. $10,550,000 should be entered as 10.55. Plan A: $ 2 million Plan B: $ million Calculate each project's IRR. Round your answer to two decimal places. Plan A % Plan B By graphing the NPV profiles for Plan A and Plan B, approximate the crossover rate to the nearest percent. % Calculate the crossover rate where the two projects' NPVS are equal, Round your answer to two decimal places. Why is NPV better than IRR for making capital budgeting decisions that add to shareholder value? The input in the box below will not be graded, but may be reviewed and considere instructor Check My Work Reset Problem engage Learning xMindTap-Cengage Learning X indexhtml?deploymentld-59028319820011545115642282198 ISBN 978 Pages Shoes Clothes Christian Songs solpas ty-NPV profiles n spreadsheet a. Calculate each project's NPV. Round your answers to two decimal places. Do not ro- $10,550,000 should be entered as 10.55. Plan A: $ million Plan B: S million Calculate each project's IRR. Round your answer to two decimal places. Plan A Pe Plan B: b. By graphing the NPV profiles for Plan A and Plan B, approximate the crossover rate % c. Calculate the crossover rate where the two projects NPVS are equal. Round your 2 H d. Why is NPV better than IRR for making capital budgeting decisions that add to sha instructor Check My Work Reset Problem DELL Back Q Search this ale integrated plant that would provide expected cash flows of $6.39 ensive plant with an expected cash flow of $2.91 million per year for 20 t and perform the required analysis to answer the questions below. ins. Enter your answers in millions. For example, an answer of have had bend n ideed his Next 69F Sunny 1001. pps 00 00 Fun S Meez Insert Arial template Home 0 -$40.00 -$13.00 Formulas #N/A NIA #N/A #NJA NPV $0.00 50.00 $0.00 $0.00 $0.00 $0.00 $0.00 $0.00 Youtube G Google Page Layout 10 Draw F 4 3 $6.39 $6.39 0 E 2 1 $6.39 $6.39 $2.91 $2.91 $2.91 Math Formulas B 5 6 7 $6.39 $6.39 $6.39 $2.91 $2.91 $2.91 $2.91 00 00 00 00 00 Sheet1 + utation Mode: Automatic Workbook Statistics EI E 4 Math Pages Formulas Data BA... 9 10 $6.39 $6.39 $6.39 $6.39 $6.39 $2.01 $2.91 $2.91 $2.91 $2.91 B 9 4. G O 1 Shoes Clothes Christian Songs Search (Alt+Q) Review View N KE D Help Editing Merge 11 12 13 36.31 $6.39 $6.39 $2.91 $2.91 1291 G 14 $6.39 $2.91 DELL 15 $6.39 Help Editing R Merge 13 14 15 $6.39 $6.39 $6.39 $2.91 $2.91 $2.91 DELL %^$ +10 00 16 17 18 19 56.39 16.30 56.39 $6.39 $2.91 $2.91 $2.91 $2.91 M 20 $6.39 $2.91 Home Insert Arial 10% 0 $40.00 -$13.00 ILIA Formula VINK D fx NST Draw VINE Page Layou 10 20% G 22% 1 2 3 4 5 6 $6.39 $6.39 $6.39 $6.39 $6.39 $6.39 $2.91 $2.91 $2.91 $2.91 $2.91 $2.91 F F #N/A ANIA #N/A #NIA #N/A H Sheet1 + on Mode Automatic Workbook Statistics Ell B& 25% 7 $6.39 $2.91 #NIA 3 $6.39 $2.91 ENIA Formulas Data Review BA.. E M 7 16.30 $6.39 $2.01 $2.91 PA 3 t 9 VINE 8 $4.39 $2.91 P Search (All +1 View W 11 $6.39 $291 9 10 16:39 56.30 $2.91 $2.91 INIA ANA men O Help vise Mergel P Q Editing Curren 12 13 14 15 56.30 $6.39 16.30 56.39 $2.91 52.91 $2.91 $2.91 TANIANIA A Search (Alt+Q) W 16 1.39 2.91 View Help 6 12 11 $6.39 $631 $2.91 32.91 A Editing Merge Currency B D DE 14 $6.39 36.30 $2.91 67 MI 15 1830 $2.91 DELL F8 1625 16 17 $6.39 1631 3291 18 16.30 $2.91 PUL F9 10 56:30 229 20 31.349 RM F10 [CH Home Arial + Sheett Page Layout B Formulas Data A OG Reve View ting Camency Step by Step Solution
There are 3 Steps involved in it
Step: 1

Get Instant Access to Expert-Tailored Solutions
See step-by-step solutions with expert insights and AI powered tools for academic success
Step: 2

Step: 3
Ace Your Homework with AI
Get the answers you need in no time with our AI-driven, step-by-step assistance
Get Started
The Handbook Of The Political Economy Of Financial Crises
Authors: Martin H. Wolfson, Gerald A. Epstein
1st Edition
0199757232, 978-0199757237