I tried the formula and still got wrong information
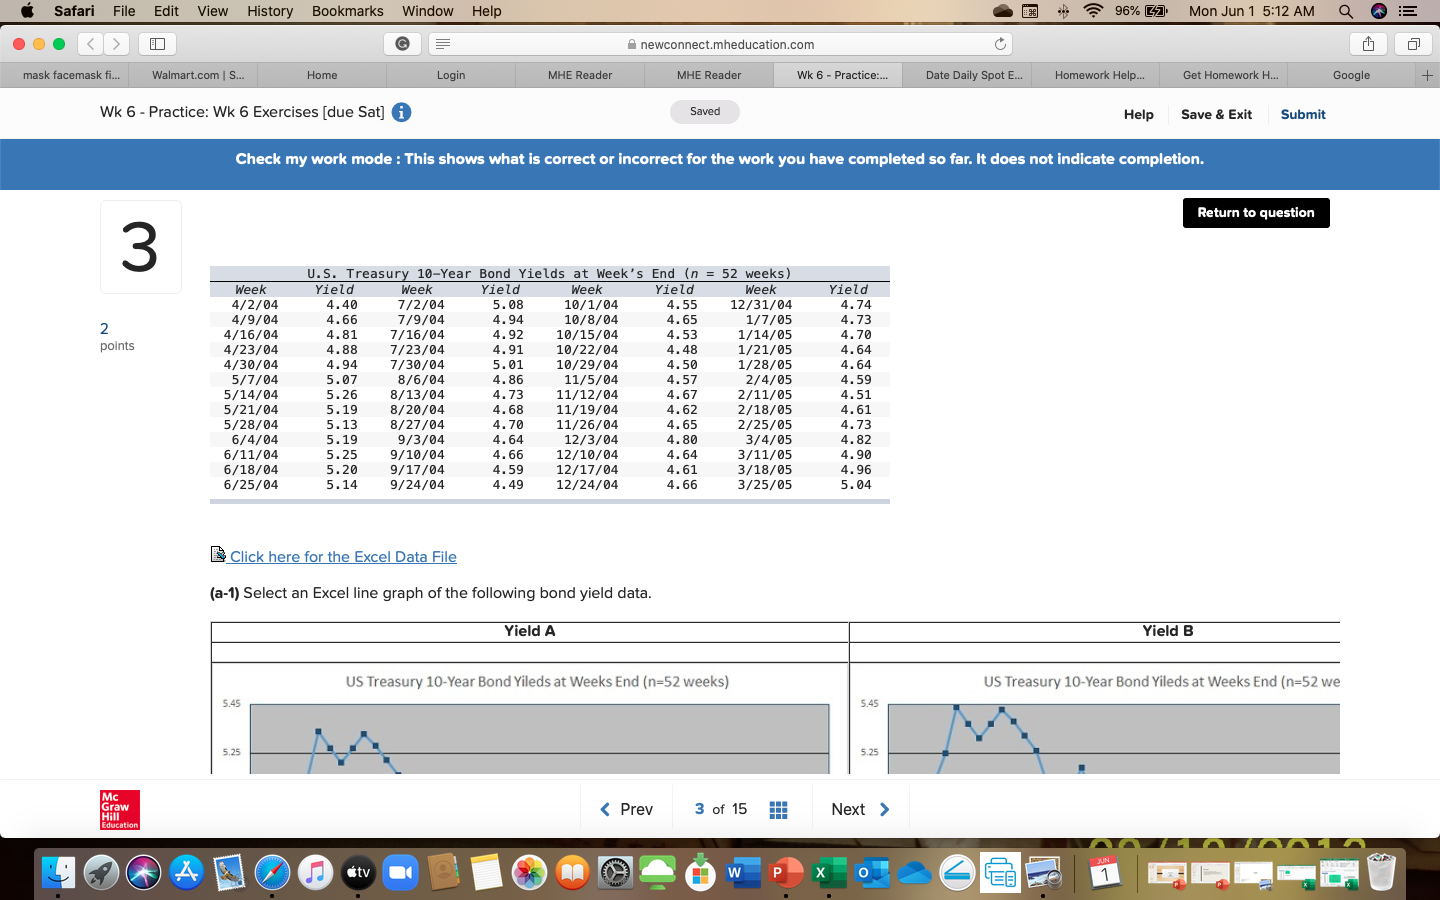
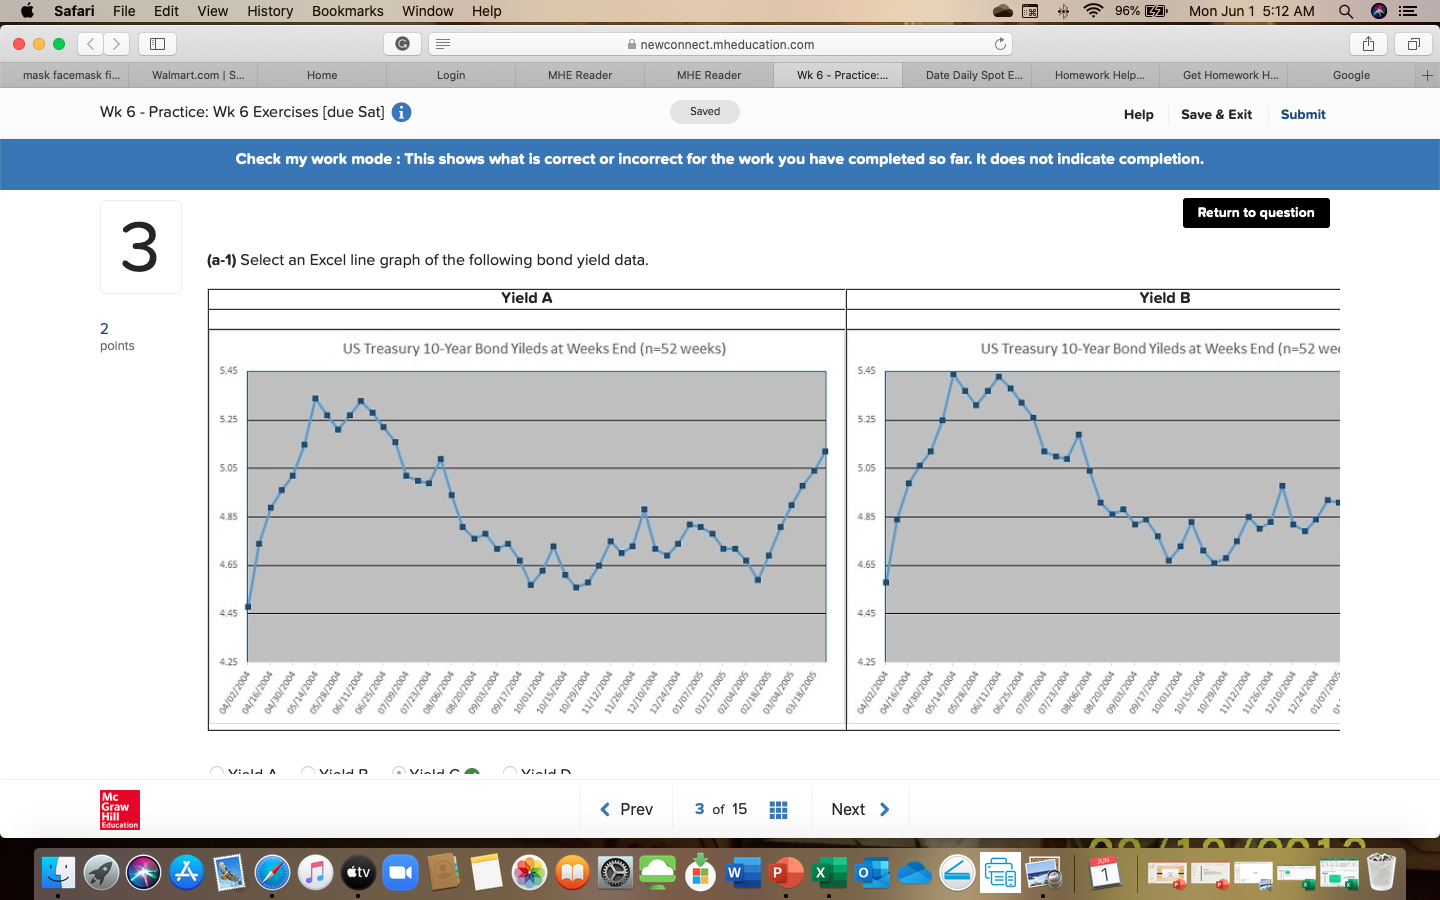
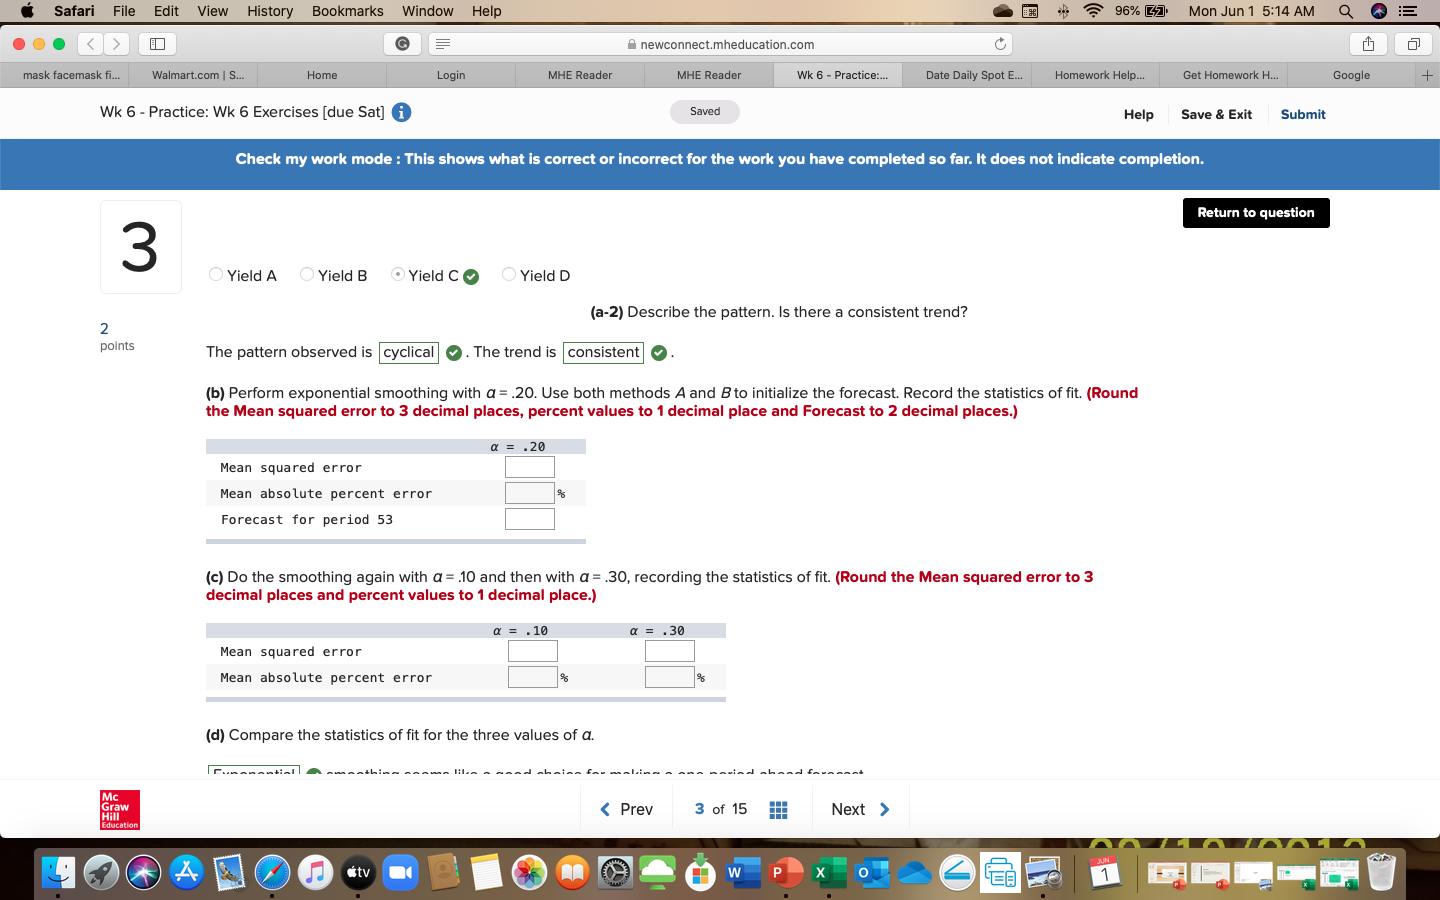
Safari File Edit View History Bookmarks Window Help 28 96% [27 Mon Jun 1 5:12 AM . . . G E newconnect.mheducation.com C mask facemask fi... Walmart.com | S... Home Login MHE Reader MHE Reader Wk 6 - Practice:... Date Daily Spot E. Homework Help... Get Homework H.. Google + Wk 6 - Practice: Wk 6 Exercises [due Sat] i Saved Help Save & Exit Submit Check my work mode : This shows what is correct or incorrect for the work you have completed so far. It does not indicate completion. Return to question 3 U. S. Treasury 10-Year Bond Yields at Week's End (n = 52 weeks) Week Yield Week Yield Week Yield Week field 4/2/04 4. 40 7/2/04 5. 08 10/1/04 4.55 12/31/04 4.74 4/9/04 4. 66 7/9/04 4.94 10/8/04 4.65 1/7/05 4.73 2 4.81 7/16/04 4.92 10/15/04 4.53 1/14/05 4.70 points 4/16/04 4/23/04 4.88 7/23/04 4.91 10/22/04 4. 48 1/21/05 4. 64 4/30/04 4.94 7/30/04 5. 01 10/29/04 4.50 1/28/05 4. 64 5/7/04 5.07 8/6/04 4. 86 11/5/04 4.57 2/4/05 4.59 5/14/04 5. 26 8/13/04 4. 73 11/12/04 4. 67 2/11/05 4.51 5/21/04 5. 19 8/20/04 4. 68 11/19/04 4. 62 2/18/05 4. 61 5/28/04 5 .13 8/27/04 4.70 11/26/04 4. 65 2/25/05 4.73 6/4/04 5.19 9/3/04 4. 64 12/3/04 4. 80 3/4/05 4. 82 6/11/04 5.25 9/10/04 4. 66 12/10/04 4. 64 3/11/05 4.90 6/18/04 5 .20 9/17/04 4.59 12/17/04 4. 61 3/18/05 4.96 6/25/04 5. 14 9/24/04 4. 49 12/24/04 4. 66 3/25/05 5.04 Click here for the Excel Data File (a-1) Select an Excel line graph of the following bond yield data. Yield A Yield B US Treasury 10-Year Bond Yileds at Weeks End (n=52 weeks) US Treasury 10-Year Bond Yileds at Weeks End (n=52 we 5.45 5.45 5.25 5.25 Mc HIATAL 4 "stv W O 1Safari File Edit View History Bookmarks Window Help 28 96% [27 Mon Jun 1 5:12 AM . . . G E newconnect.mheducation.com C mask facemask fi... Walmart.com | S... Home Login MHE Reader MHE Reader Wk 6 - Practice:... Date Daily Spot E. Homework Help.. Get Homework H.. Google + Wk 6 - Practice: Wk 6 Exercises [due Sat] i Saved Help Save & Exit Submit Check my work mode : This shows what is correct or incorrect for the work you have completed so far. It does not indicate completion. 3 Return to question (a-1) Select an Excel line graph of the following bond yield data. Yield A Yield B 2 points US Treasury 10-Year Bond Yileds at Weeks End (n=52 weeks) US Treasury 10-Year Bond Yileds at Weeks End (n=52 we 5.45 5.49 5.25 5.25 5.05 5.05 4.85 4.85 4.65 4.65 4,45 4,45 4.25 4.25 04/02/2004 04/16/2004 04/30/2004 05/14/2004 05/28/2004 06/11/2004 06/25/2004 07/09/2004 07/23/2004 08/06/2004 08/20/2004 09/03/2004 09/17/2004 10/01/2004 10/15/2004 10/29/2004 11/12/2004 11/26/2004 12/10/2004 12/24/2004 01/07/2005 01/21/2005 02/04/2005 02/18/2005 03/04/2005 03/18/2005 04/02/2004 04/16/2004 04/30/2004 05/14/2004 05/28/2004 06/11/2004 06/25/2004 07/09/2004 07/23/2004 08/06/2004 OB/20/2004 09/03/2004 09/17/2004 10/01/2004 10/15/2004 10/29/2004 11/12/2004 11/26/2004 12/10/2004 12/24/2004 01/07/2005 viald A Aviala D .Vialdra A vialan Mc TATA W O 1. O - Lilli I : | I 0 ll .2 newcannect.rnheducaiiun.cum (DJ | E ElI Wk 6 Practice: Wk 6 Exercises [due Sat] 3 Saved Help Save a em Submit Check my work mode : This shows what is correct or incorrect for the work you have completed so far. It does not indicate completion. WIN-5 The pattern observed is cyclical o The trend is consistent o t Yield A Yield B ' Yield C 0 Yield D (a-2) Describe the pattern. Is there a consistent trend? (bl Perform exponential smoothing with a = 2Q Use both methods A and Bto initialize the forecast Record the statistics ofL (Round the Mean squared error to 3 decimal places, percent values to 1 decimal place and Forecast to 2 decimal places.) a- .20 Mean squared errur Mean absolute percent error it: Forecast for period 53 (:1 Do the smoothing again with CI = .10 and then with o = '30, recording the statistics of fit. [Round the Mean squared error to 3 decimal places and percent values to 1 decimal place.) 11-.10 e-.30 Mean squared error Mean ahsnLute percent error a a, (d) Compare the statisti of t for the three values of EL