

Question: I understand we cannot post multiple questions but these 6 are under the same question on my assignment and i need help Vanguard Information Technology
I understand we cannot post multiple questions but these 6 are under the same question on my assignment and i need help
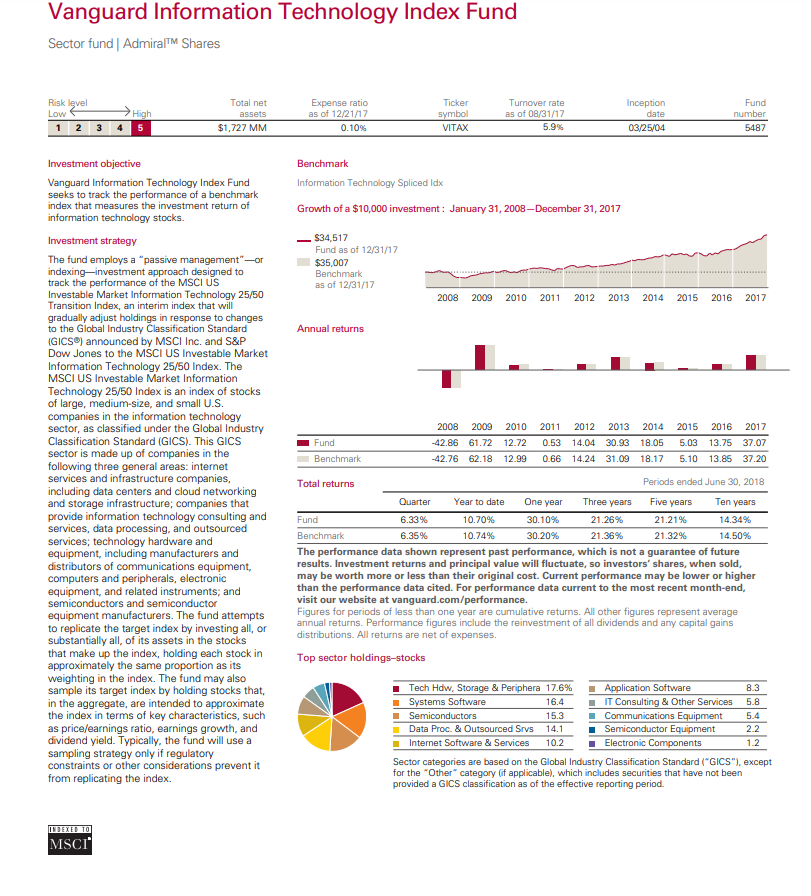
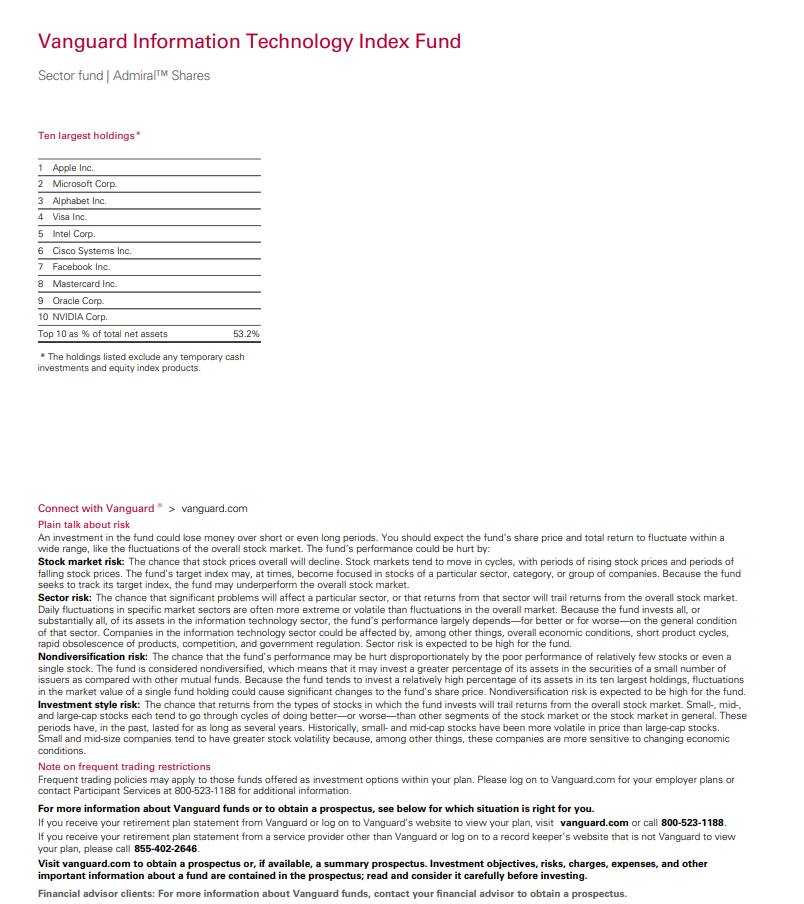
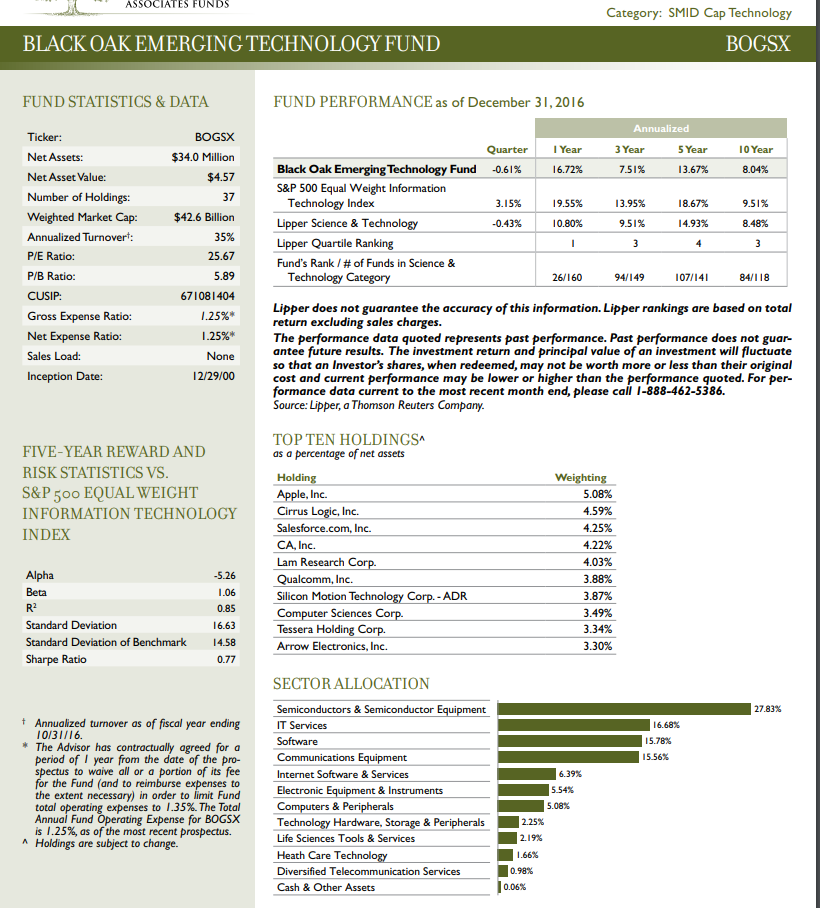
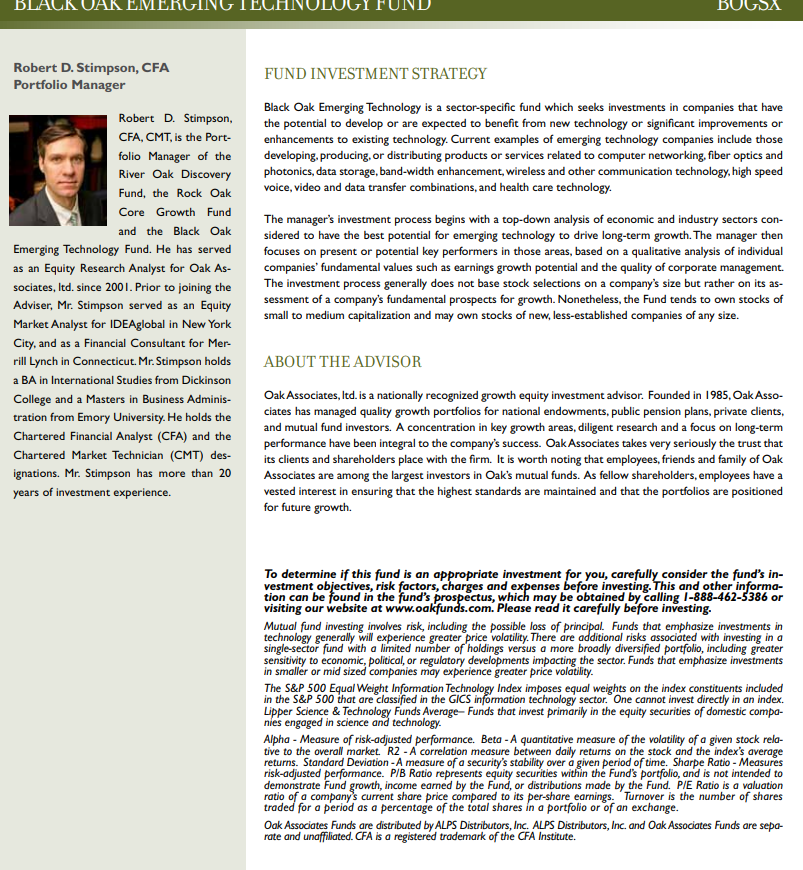
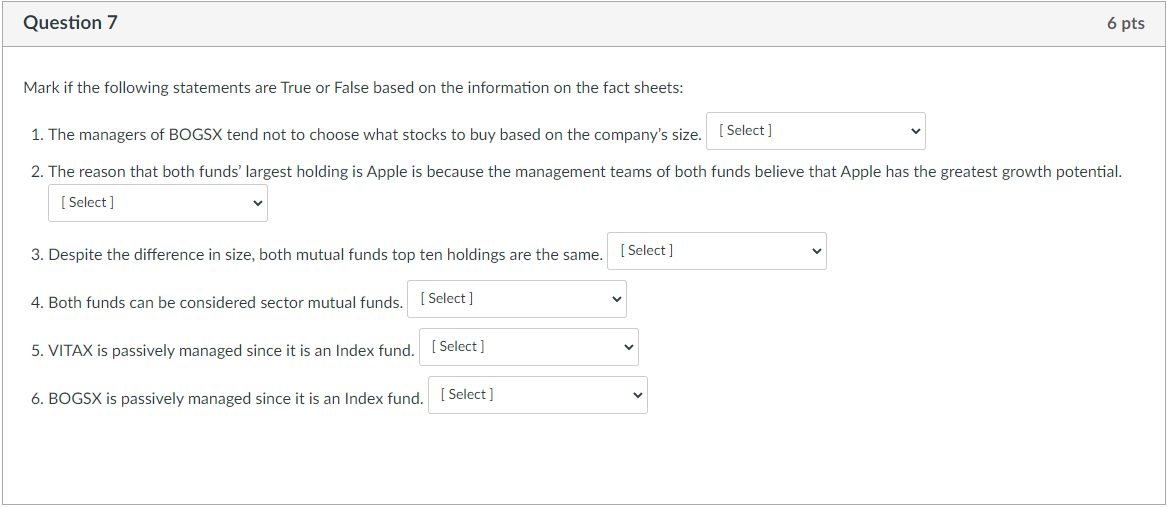
Vanguard Information Technology Index Fund Sector fund | AdmiralTM Shares Risk level Low 1 2 High Total net assets $1,727 MM Expense ratio as of 12/21/17 0.10% Ticker symbol VITAX Turnover rate as of 08/31/17 5.9% Inception date 03/25/04 Fund number 5487 3 4 Benchmark Information Technology Spliced Idx Growth of a $10,000 investment: January 31, 2008 December 31, 2017 $34,517 Fund as of 12/31/17 $35,007 Benchmark as of 12/31/17 2008 2009 2010 2011 2012 2013 2014 2015 2016 2017 Annual returns Fund Benchmark 2008 2009 2010 -42.86 61.72 12.72 -42.76 62.18 12.99 2011 2012 2013 0.53 14.04 30.93 0.66 14.24 31.09 2014 18.05 18.17 2015 5.03 5.10 2016 2017 13.75 37.07 13.85 37.20 Investment objective Vanguard Information Technology Index Fund seeks to track the performance of a benchmark index that measures the investment return of information technology stocks. Investment strategy The fund employs a "passive management"or indexing-investment approach designed to track the performance of the MSCI US Investable Market Information Technology 25/50 Transition Index, an interim index that will gradually adjust holdings in response to changes to the Global Industry Classification Standard (GICS) announced by MSCI Inc. and S&P Dow Jones to the MSCI US Investable Market Information Technology 25/50 Index. The MSCI US Investable Market Information Technology 25/50 Index is an index of stocks of large, medium-size, and small U.S. companies in the information technology sector, as classified under the Global Industry Classification Standard (GICS). This GICS sector is made up of companies in the following three general areas: internet Services and infrastructure companies, including data centers and cloud networking and storage infrastructure; companies that provide information technology consulting and services, data processing, and outsourced services; technology hardware and equipment, including manufacturers and distributors of communications equipment, computers and peripherals, electronic equipment, and related instruments; and semiconductors and semiconductor equipment manufacturers. The fund attempts to replicate the target index by investing all, or substantially all of its assets in the stocks that make up the index, holding each stock in approximately the same proportion as its weighting in the index. The fund may also sample its target index by holding stocks that, in the aggregate, are intended to approximate the index in terms of key characteristics, such as price/earnings ratio, earnings growth, and dividend yield. Typically, the fund will use a sampling strategy only if regulatory constraints or other considerations prevent it from replicating the index Total returns Periods ended June 30, 2018 Quarter Year to date One year Three years Five years Ten years Fund 6.33% 10.70% 30.10% 21.26% 21.21% 14.34% Benchmark 6.35% 10.74% 30.20% 21.36% 21.32% 14.50% The performance data shown represent past performance, which is not a guarantee of future results. Investment returns and principal value will fluctuate, so investors' shares, when sold, may be worth more or less than their original cost. Current performance may be lower or higher than the performance data cited. For performance data current to the most recent month-end, visit our website at vanguard.com/performance. Figures for periods of less than one year are cumulative returns. All other figures represent average annual returns. Performance figures include the reinvestment of all dividends and any capital gains distributions. All returns are net of expenses. Top sector holdings-stocks Tech Hdw, Storage & Periphera 17.6% Application Software 8.3 Systems Software 16.4 IT Consulting & Other Services 5.8 Semiconductors 15.3 Communications Equipment 5.4 Data Proc. & Outsourced Srvs 14.1 Semiconductor Equipment 2.2 Internet Software & Services 10.2 Electronic Components 1.2 Sector categories are based on the Global Industry Classification Standard ("GICS"), except for the "Other" category (if applicable), which includes securities that have not been provided a GICS classification as of the effective reporting period. LDEXED TO MSCI Vanguard Information Technology Index Fund Sector fund | AdmiralTM Shares Ten largest holdings* 1 Apple Inc. 2 Microsoft Corp. 3 Alphabet Inc. 4 Visa Inc 5 Intel Corp. 6 Cisco Systems Inc. 7 Facebook Inc. 8 Mastercard Inc. 9 Oracle Corp 10 NVIDIA Corp. Top 10 as % of total net assets 53.2% * The holdings listed exclude any temporary cash investments and equity index products, Connect with Vanguard > vanguard.com Plain talk about risk An investment in the fund could lose money over short or even long periods. You should expect the fund's share price and total return to fluctuate within a wide range, like the fluctuations of the overall stock market. The fund's performance could be hurt by: Stock market risk: The chance that stock prices overall will decline. Stock markets tend to move in cycles, with periods of rising stock prices and periods of falling stock prices. The fund's target index may, at times, become focused in stocks of a particular sector, category, or group of companies. Because the fund seeks to track its target index, the fund may underperform the overall stock market. Sector risk: The chance that significant problems will affect a particular sector, or that returns from that sector will trail returns from the overall stock market. Daily fluctuations in specific market sectors are often more extreme or volatile than fluctuations in the overall market. Because the fund invests all, or substantially all of its assets in the information technology sector, the fund's performance largely dependsfor better or for worseon the general condition of that sector. Companies in the information technology sector could be affected by, among other things, overall economic conditions, short product cycles, rapid obsolescence of products, competition, and government regulation. Sector risk is expected to be high for the fund. Nondiversification risk: The chance that the fund's performance may be hurt disproportionately by the poor performance of relatively few stocks or even a single stock. The fund is considered nondiversified, which means that it may invest a greater percentage of its assets in the securities of a small number of issuers as compared with other mutual funds. Because the fund tends to invest a relatively high percentage of its assets in its ten largest holdings, fluctuations in the market value of a single fund holding could cause significant changes to the fund's share price. Nondiversification risk is expected to be high for the fund. Investment style risk: The chance that returns from the types of stocks in which the fund invests will trail returns from the overall stock market. Small-, mid-, and large-cap stocks each tend to go through cycles of doing betteror worse-than other segments of the stock market or the stock market in general. These periods have, in the past, lasted for as long as several years. Historically, small and mid-cap stocks have been more volatile in price than large-cap stocks. Small and mid-size companies tend to have greater stock volatility because, among other things, these companies are more sensitive to changing economic conditions. Note on frequent trading restrictions Frequent trading policies may apply to those funds offered as investment options within your plan. Please log on to Vanguard.com for your employer plans or contact Participant Services at 800-523-1188 for additional information. For more information about Vanguard funds or to obtain a prospectus, see below for which situation is right for you. If you receive your retirement plan statement from Vanguard or log on to Vanguard's website to view your plan, visit vanguard.com or call 800-523-1188 If you receive your retirement plan statement from a service provider other than Vanguard or log on to a record keeper's website that is not Vanguard to view your plan, please call 855-402-2646 Visit vanguard.com to obtain a prospectus or, if available, a summary prospectus. Investment objectives, risks, charges, expenses, and other important information about a fund are contained in the prospectus; read and consider it carefully before investing. Financial advisor clients: For more information about Vanguard funds, contact your financial advisor to obtain a prospectus. ASSOCIATES FUNDS Category: SMID Cap Technology BOGSX BLACK OAK EMERGING TECHNOLOGY FUND FUND STATISTICS & DATA 7.51% 13.67% 8.04% 3.15% 13.95% 18.67% -0.43% 9.51% 14.93% 8.48% I 3 4 3 Ticker: Net Assets: Net Asset Value: Number of Holdings: Weighted Market Cap: Annualized Turnovert: P/E Ratio: P/B Ratio: CUSIP Gross Expense Ratio: Net Expense Ratio: Sales Load: Inception Date: BOGSX $34.0 Million $4.57 37 $42.6 Billion 35% 25.67 5.89 671081404 1.25% 1.25%* None 12/29/00 FUND PERFORMANCE as of December 31, 2016 Annualized Quarter 1 Year 3 Year 5 Year 10 Year Black Oak Emerging Technology Fund -0.61% 16.72% S&P 500 Equal Weight Information Technology Index 19.55% 9.51% Lipper Science & Technology 10.80% Lipper Quartile Ranking Fund's Rank/# of Funds in Science & Technology Category Lipper does not guarantee the accuracy of this information. Lipper rankings are based on total return excluding sales charges. The performance data quoted represents past performance. Past performance does not guar- antee future results. The investment return and principal value of an investment will fluctuate so that an Investor's shares, when redeemed, may not be worth more or less than their original cost and current performance may be lower or higher than the performance quoted. For per- formance data current to the most recent month end, please call 1-888-462-5386. Source: Lipper, a Thomson Reuters Company. 26/160 94/149 107/141 84/118 FIVE-YEAR REWARD AND RISK STATISTICS VS. S&P 500 EQUAL WEIGHT INFORMATION TECHNOLOGY INDEX TOP TEN HOLDINGS as a percentage of net assets Holding Apple, Inc. Cirrus Logic, Inc. Salesforce.com, Inc. CA, Inc. Lam Research Corp. Qualcomm, Inc. Silicon Motion Technology Corp.- ADR Computer Sciences Corp. Tessera Holding Corp. Arrow Electronics, Inc. Weighting 5.08% 4.59% 4.25% 4.22% 4.03% 3.88% 3.87% 3.49% 3.34% 3.30% -5.26 Alpha Beta RP Standard Deviation Standard Deviation of Benchmark Sharpe Ratio 1.06 0.85 16.63 14.58 0.77 27.83% 16.68% 15.78% 15.56% + Annualized turnover as of fiscal year ending 10/31/16 * The Advisor has contractually agreed for a period of year from the date of the pro- spectus to waive all or a portion of its fee for the Fund (and to reimburse expenses to the extent necessary) in order to limit Fund total operating expenses to 1.35%. The Total Annual Fund Operating Expense for BOGSX is 1.25%, as of the most recent prospectus. ^ Holdings are subject to change. SECTOR ALLOCATION Semiconductors & Semiconductor Equipment IT Services Software Communications Equipment Internet Software & Services Electronic Equipment & Instruments Computers & Peripherals Technology Hardware, Storage & Peripherals Life Sciences Tools & Services Heath Care Technology Diversified Telecommunication Services Cash & Other Assets 6.39% 5.54% 5.08% 2.25% 2.19% 1.66% 0.98% 0.06% BLACK OAK EMER FUN BUGOA Robert D. Stimpson, CFA Portfolio Manager Robert D. Stimpson, CFA, CMT, is the Port- folio Manager of the River Oak Discovery Fund, the Rock Oak Core Growth Fund and the Black Oak Emerging Technology Fund. He has served as an Equity Research Analyst for Oak As- sociates, Itd. since 2001. Prior to joining the Adviser, Mr. Stimpson served as an Equity Market Analyst for IDEAglobal in New York City, and as a Financial Consultant for Mer- rill Lynch in Connecticut. Mr. Stimpson holds a BA in International Studies from Dickinson College and a Masters in Business Adminis- tration from Emory University. He holds the Chartered Financial Analyst (CFA) and the Chartered Market Technician (CMT) des- ignations. Mr. Stimpson has more than 20 years of investment experience. FUND INVESTMENT STRATEGY Black Oak Emerging Technology is a sector-specific fund which seeks investments in companies that have the potential to develop or are expected to benefit from new technology or significant improvements or enhancements to existing technology. Current examples of emerging technology companies include those developing, producing, or distributing products or services related to computer networking, fiber optics and photonics, data storage, band-width enhancement, wireless and other communication technology, high speed voice, video and data transfer combinations, and health care technology. The manager's investment process begins with a top-down analysis of economic and industry sectors con- sidered to have the best potential for emerging technology to drive long-term growth. The manager then focuses on present or potential key performers in those areas, based on a qualitative analysis of individual companies' fundamental values such as earnings growth potential and the quality of corporate management. The investment process generally does not base stock selections on a company's size but rather on its as- sessment of a company's fundamental prospects for growth. Nonetheless, the Fund tends to own stocks of small to medium capitalization and may own stocks of new, less-established companies of any size. ABOUT THE ADVISOR Oak Associates, Itd. is a nationally recognized growth equity investment advisor. Founded in 1985, Oak Asso- ciates has managed quality growth portfolios for national endowments, public pension plans, private clients, and mutual fund investors. A concentration in key growth areas, diligent research and a focus on long-term performance have been integral to the company's success. Oak Associates takes very seriously the trust that its clients and shareholders place with the firm. It is worth noting that employees, friends and family of Oak Associates are among the largest investors in Oak's mutual funds. As fellow shareholders, employees have a vested interest in ensuring that the highest standards are maintained and that the portfolios are positioned for future growth. To determine if this fund is an appropriate investment for you, carefully consider the funds in- vestment objectives, risk factors, charges and expenses before investing. This and other informa- tion can be found in the fund's prospectus, which may be obtained by calling 1-888-462-5386 or visiting our website at www.oakfunds.com. Please read it carefully before investing. Mutual fund investing involves risk, including the possible loss of principal. Funds that emphasize investments in technology generally will experience greater price volatility. There are additional risks associated with investing in a single-sector fund with a limited number of holdings versus a more broadly diversified portfolio, including greater sensitivity to economic, political, or regulatory developments impacting the sector. Funds that emphasize investments in smaller or mid sized companies may experience greater price volatility. The S&P 500 Equal Weight Information Technology Index imposes equal weights on the index constituents included in the S&P 500 that are classified in the GICS information technology sector. One cannot invest directly in an index. Lipper Science & Technology Funds Average- Funds that invest primarily in the equity securities of domestic compa- nies engaged in science and technology Alpha - Measure of risk-adjusted performance. Beta- A quantitative measure of the volatility of a given stock rela- tive to the overall market. R2 - A correlation measure between daily returns on the stock and the index's average returns. Standard Deviation - A measure of a security's stability over a given period of time. Sharpe Ratio - Measures risk-adjusted performance. P/B Ratio represents equity securities within the Fund's portfolio, and is not intended to demonstrate Fund growth, income earned by the Fund, or distributions made by the Fund. PIE Ratio is a valuation ratio of a company's current share price compared to its per-share earnings. 'Turnover is the number of shares traded for a period as a percentage of the total shares in a portfolio or of an exchange. Oak Associates Funds are distributed by ALPS Distributors, Inc. ALPS Distributors, Inc. and Oak Associates Funds are sepa- rate and unaffiliated. CFA is a registered trademark of the CFA Institute. Question 7 6 pts Mark if the following statements are True or False based on the information on the fact sheets: 1. The managers of BOGSX tend not to choose what stocks to buy based on the company's size. (Select] 2. The reason that both funds' largest holding is Apple is because the management teams of both funds believe that Apple has the greatest growth potential. Select] 3. Despite the difference in size, both mutual funds top ten holdings are the same. Select] 4. Both funds can be considered sector mutual funds. Select ] 5. VITAX is passively managed since it is an Index fund. [Select] 6. BOGSX is passively managed since it is an Index fund. [Select] Vanguard Information Technology Index Fund Sector fund | AdmiralTM Shares Risk level Low 1 2 High Total net assets $1,727 MM Expense ratio as of 12/21/17 0.10% Ticker symbol VITAX Turnover rate as of 08/31/17 5.9% Inception date 03/25/04 Fund number 5487 3 4 Benchmark Information Technology Spliced Idx Growth of a $10,000 investment: January 31, 2008 December 31, 2017 $34,517 Fund as of 12/31/17 $35,007 Benchmark as of 12/31/17 2008 2009 2010 2011 2012 2013 2014 2015 2016 2017 Annual returns Fund Benchmark 2008 2009 2010 -42.86 61.72 12.72 -42.76 62.18 12.99 2011 2012 2013 0.53 14.04 30.93 0.66 14.24 31.09 2014 18.05 18.17 2015 5.03 5.10 2016 2017 13.75 37.07 13.85 37.20 Investment objective Vanguard Information Technology Index Fund seeks to track the performance of a benchmark index that measures the investment return of information technology stocks. Investment strategy The fund employs a "passive management"or indexing-investment approach designed to track the performance of the MSCI US Investable Market Information Technology 25/50 Transition Index, an interim index that will gradually adjust holdings in response to changes to the Global Industry Classification Standard (GICS) announced by MSCI Inc. and S&P Dow Jones to the MSCI US Investable Market Information Technology 25/50 Index. The MSCI US Investable Market Information Technology 25/50 Index is an index of stocks of large, medium-size, and small U.S. companies in the information technology sector, as classified under the Global Industry Classification Standard (GICS). This GICS sector is made up of companies in the following three general areas: internet Services and infrastructure companies, including data centers and cloud networking and storage infrastructure; companies that provide information technology consulting and services, data processing, and outsourced services; technology hardware and equipment, including manufacturers and distributors of communications equipment, computers and peripherals, electronic equipment, and related instruments; and semiconductors and semiconductor equipment manufacturers. The fund attempts to replicate the target index by investing all, or substantially all of its assets in the stocks that make up the index, holding each stock in approximately the same proportion as its weighting in the index. The fund may also sample its target index by holding stocks that, in the aggregate, are intended to approximate the index in terms of key characteristics, such as price/earnings ratio, earnings growth, and dividend yield. Typically, the fund will use a sampling strategy only if regulatory constraints or other considerations prevent it from replicating the index Total returns Periods ended June 30, 2018 Quarter Year to date One year Three years Five years Ten years Fund 6.33% 10.70% 30.10% 21.26% 21.21% 14.34% Benchmark 6.35% 10.74% 30.20% 21.36% 21.32% 14.50% The performance data shown represent past performance, which is not a guarantee of future results. Investment returns and principal value will fluctuate, so investors' shares, when sold, may be worth more or less than their original cost. Current performance may be lower or higher than the performance data cited. For performance data current to the most recent month-end, visit our website at vanguard.com/performance. Figures for periods of less than one year are cumulative returns. All other figures represent average annual returns. Performance figures include the reinvestment of all dividends and any capital gains distributions. All returns are net of expenses. Top sector holdings-stocks Tech Hdw, Storage & Periphera 17.6% Application Software 8.3 Systems Software 16.4 IT Consulting & Other Services 5.8 Semiconductors 15.3 Communications Equipment 5.4 Data Proc. & Outsourced Srvs 14.1 Semiconductor Equipment 2.2 Internet Software & Services 10.2 Electronic Components 1.2 Sector categories are based on the Global Industry Classification Standard ("GICS"), except for the "Other" category (if applicable), which includes securities that have not been provided a GICS classification as of the effective reporting period. LDEXED TO MSCI Vanguard Information Technology Index Fund Sector fund | AdmiralTM Shares Ten largest holdings* 1 Apple Inc. 2 Microsoft Corp. 3 Alphabet Inc. 4 Visa Inc 5 Intel Corp. 6 Cisco Systems Inc. 7 Facebook Inc. 8 Mastercard Inc. 9 Oracle Corp 10 NVIDIA Corp. Top 10 as % of total net assets 53.2% * The holdings listed exclude any temporary cash investments and equity index products, Connect with Vanguard > vanguard.com Plain talk about risk An investment in the fund could lose money over short or even long periods. You should expect the fund's share price and total return to fluctuate within a wide range, like the fluctuations of the overall stock market. The fund's performance could be hurt by: Stock market risk: The chance that stock prices overall will decline. Stock markets tend to move in cycles, with periods of rising stock prices and periods of falling stock prices. The fund's target index may, at times, become focused in stocks of a particular sector, category, or group of companies. Because the fund seeks to track its target index, the fund may underperform the overall stock market. Sector risk: The chance that significant problems will affect a particular sector, or that returns from that sector will trail returns from the overall stock market. Daily fluctuations in specific market sectors are often more extreme or volatile than fluctuations in the overall market. Because the fund invests all, or substantially all of its assets in the information technology sector, the fund's performance largely dependsfor better or for worseon the general condition of that sector. Companies in the information technology sector could be affected by, among other things, overall economic conditions, short product cycles, rapid obsolescence of products, competition, and government regulation. Sector risk is expected to be high for the fund. Nondiversification risk: The chance that the fund's performance may be hurt disproportionately by the poor performance of relatively few stocks or even a single stock. The fund is considered nondiversified, which means that it may invest a greater percentage of its assets in the securities of a small number of issuers as compared with other mutual funds. Because the fund tends to invest a relatively high percentage of its assets in its ten largest holdings, fluctuations in the market value of a single fund holding could cause significant changes to the fund's share price. Nondiversification risk is expected to be high for the fund. Investment style risk: The chance that returns from the types of stocks in which the fund invests will trail returns from the overall stock market. Small-, mid-, and large-cap stocks each tend to go through cycles of doing betteror worse-than other segments of the stock market or the stock market in general. These periods have, in the past, lasted for as long as several years. Historically, small and mid-cap stocks have been more volatile in price than large-cap stocks. Small and mid-size companies tend to have greater stock volatility because, among other things, these companies are more sensitive to changing economic conditions. Note on frequent trading restrictions Frequent trading policies may apply to those funds offered as investment options within your plan. Please log on to Vanguard.com for your employer plans or contact Participant Services at 800-523-1188 for additional information. For more information about Vanguard funds or to obtain a prospectus, see below for which situation is right for you. If you receive your retirement plan statement from Vanguard or log on to Vanguard's website to view your plan, visit vanguard.com or call 800-523-1188 If you receive your retirement plan statement from a service provider other than Vanguard or log on to a record keeper's website that is not Vanguard to view your plan, please call 855-402-2646 Visit vanguard.com to obtain a prospectus or, if available, a summary prospectus. Investment objectives, risks, charges, expenses, and other important information about a fund are contained in the prospectus; read and consider it carefully before investing. Financial advisor clients: For more information about Vanguard funds, contact your financial advisor to obtain a prospectus. ASSOCIATES FUNDS Category: SMID Cap Technology BOGSX BLACK OAK EMERGING TECHNOLOGY FUND FUND STATISTICS & DATA 7.51% 13.67% 8.04% 3.15% 13.95% 18.67% -0.43% 9.51% 14.93% 8.48% I 3 4 3 Ticker: Net Assets: Net Asset Value: Number of Holdings: Weighted Market Cap: Annualized Turnovert: P/E Ratio: P/B Ratio: CUSIP Gross Expense Ratio: Net Expense Ratio: Sales Load: Inception Date: BOGSX $34.0 Million $4.57 37 $42.6 Billion 35% 25.67 5.89 671081404 1.25% 1.25%* None 12/29/00 FUND PERFORMANCE as of December 31, 2016 Annualized Quarter 1 Year 3 Year 5 Year 10 Year Black Oak Emerging Technology Fund -0.61% 16.72% S&P 500 Equal Weight Information Technology Index 19.55% 9.51% Lipper Science & Technology 10.80% Lipper Quartile Ranking Fund's Rank/# of Funds in Science & Technology Category Lipper does not guarantee the accuracy of this information. Lipper rankings are based on total return excluding sales charges. The performance data quoted represents past performance. Past performance does not guar- antee future results. The investment return and principal value of an investment will fluctuate so that an Investor's shares, when redeemed, may not be worth more or less than their original cost and current performance may be lower or higher than the performance quoted. For per- formance data current to the most recent month end, please call 1-888-462-5386. Source: Lipper, a Thomson Reuters Company. 26/160 94/149 107/141 84/118 FIVE-YEAR REWARD AND RISK STATISTICS VS. S&P 500 EQUAL WEIGHT INFORMATION TECHNOLOGY INDEX TOP TEN HOLDINGS as a percentage of net assets Holding Apple, Inc. Cirrus Logic, Inc. Salesforce.com, Inc. CA, Inc. Lam Research Corp. Qualcomm, Inc. Silicon Motion Technology Corp.- ADR Computer Sciences Corp. Tessera Holding Corp. Arrow Electronics, Inc. Weighting 5.08% 4.59% 4.25% 4.22% 4.03% 3.88% 3.87% 3.49% 3.34% 3.30% -5.26 Alpha Beta RP Standard Deviation Standard Deviation of Benchmark Sharpe Ratio 1.06 0.85 16.63 14.58 0.77 27.83% 16.68% 15.78% 15.56% + Annualized turnover as of fiscal year ending 10/31/16 * The Advisor has contractually agreed for a period of year from the date of the pro- spectus to waive all or a portion of its fee for the Fund (and to reimburse expenses to the extent necessary) in order to limit Fund total operating expenses to 1.35%. The Total Annual Fund Operating Expense for BOGSX is 1.25%, as of the most recent prospectus. ^ Holdings are subject to change. SECTOR ALLOCATION Semiconductors & Semiconductor Equipment IT Services Software Communications Equipment Internet Software & Services Electronic Equipment & Instruments Computers & Peripherals Technology Hardware, Storage & Peripherals Life Sciences Tools & Services Heath Care Technology Diversified Telecommunication Services Cash & Other Assets 6.39% 5.54% 5.08% 2.25% 2.19% 1.66% 0.98% 0.06% BLACK OAK EMER FUN BUGOA Robert D. Stimpson, CFA Portfolio Manager Robert D. Stimpson, CFA, CMT, is the Port- folio Manager of the River Oak Discovery Fund, the Rock Oak Core Growth Fund and the Black Oak Emerging Technology Fund. He has served as an Equity Research Analyst for Oak As- sociates, Itd. since 2001. Prior to joining the Adviser, Mr. Stimpson served as an Equity Market Analyst for IDEAglobal in New York City, and as a Financial Consultant for Mer- rill Lynch in Connecticut. Mr. Stimpson holds a BA in International Studies from Dickinson College and a Masters in Business Adminis- tration from Emory University. He holds the Chartered Financial Analyst (CFA) and the Chartered Market Technician (CMT) des- ignations. Mr. Stimpson has more than 20 years of investment experience. FUND INVESTMENT STRATEGY Black Oak Emerging Technology is a sector-specific fund which seeks investments in companies that have the potential to develop or are expected to benefit from new technology or significant improvements or enhancements to existing technology. Current examples of emerging technology companies include those developing, producing, or distributing products or services related to computer networking, fiber optics and photonics, data storage, band-width enhancement, wireless and other communication technology, high speed voice, video and data transfer combinations, and health care technology. The manager's investment process begins with a top-down analysis of economic and industry sectors con- sidered to have the best potential for emerging technology to drive long-term growth. The manager then focuses on present or potential key performers in those areas, based on a qualitative analysis of individual companies' fundamental values such as earnings growth potential and the quality of corporate management. The investment process generally does not base stock selections on a company's size but rather on its as- sessment of a company's fundamental prospects for growth. Nonetheless, the Fund tends to own stocks of small to medium capitalization and may own stocks of new, less-established companies of any size. ABOUT THE ADVISOR Oak Associates, Itd. is a nationally recognized growth equity investment advisor. Founded in 1985, Oak Asso- ciates has managed quality growth portfolios for national endowments, public pension plans, private clients, and mutual fund investors. A concentration in key growth areas, diligent research and a focus on long-term performance have been integral to the company's success. Oak Associates takes very seriously the trust that its clients and shareholders place with the firm. It is worth noting that employees, friends and family of Oak Associates are among the largest investors in Oak's mutual funds. As fellow shareholders, employees have a vested interest in ensuring that the highest standards are maintained and that the portfolios are positioned for future growth. To determine if this fund is an appropriate investment for you, carefully consider the funds in- vestment objectives, risk factors, charges and expenses before investing. This and other informa- tion can be found in the fund's prospectus, which may be obtained by calling 1-888-462-5386 or visiting our website at www.oakfunds.com. Please read it carefully before investing. Mutual fund investing involves risk, including the possible loss of principal. Funds that emphasize investments in technology generally will experience greater price volatility. There are additional risks associated with investing in a single-sector fund with a limited number of holdings versus a more broadly diversified portfolio, including greater sensitivity to economic, political, or regulatory developments impacting the sector. Funds that emphasize investments in smaller or mid sized companies may experience greater price volatility. The S&P 500 Equal Weight Information Technology Index imposes equal weights on the index constituents included in the S&P 500 that are classified in the GICS information technology sector. One cannot invest directly in an index. Lipper Science & Technology Funds Average- Funds that invest primarily in the equity securities of domestic compa- nies engaged in science and technology Alpha - Measure of risk-adjusted performance. Beta- A quantitative measure of the volatility of a given stock rela- tive to the overall market. R2 - A correlation measure between daily returns on the stock and the index's average returns. Standard Deviation - A measure of a security's stability over a given period of time. Sharpe Ratio - Measures risk-adjusted performance. P/B Ratio represents equity securities within the Fund's portfolio, and is not intended to demonstrate Fund growth, income earned by the Fund, or distributions made by the Fund. PIE Ratio is a valuation ratio of a company's current share price compared to its per-share earnings. 'Turnover is the number of shares traded for a period as a percentage of the total shares in a portfolio or of an exchange. Oak Associates Funds are distributed by ALPS Distributors, Inc. ALPS Distributors, Inc. and Oak Associates Funds are sepa- rate and unaffiliated. CFA is a registered trademark of the CFA Institute. Question 7 6 pts Mark if the following statements are True or False based on the information on the fact sheets: 1. The managers of BOGSX tend not to choose what stocks to buy based on the company's size. (Select] 2. The reason that both funds' largest holding is Apple is because the management teams of both funds believe that Apple has the greatest growth potential. Select] 3. Despite the difference in size, both mutual funds top ten holdings are the same. Select] 4. Both funds can be considered sector mutual funds. Select ] 5. VITAX is passively managed since it is an Index fund. [Select] 6. BOGSX is passively managed since it is an Index fund. [Select]
Step by Step Solution
There are 3 Steps involved in it

Get step-by-step solutions from verified subject matter experts