

Question
I. Using an appropriate graphical display and the summary statistics, describe the distribution of BOTH length and weight of II. Using an appropriate graphical format,
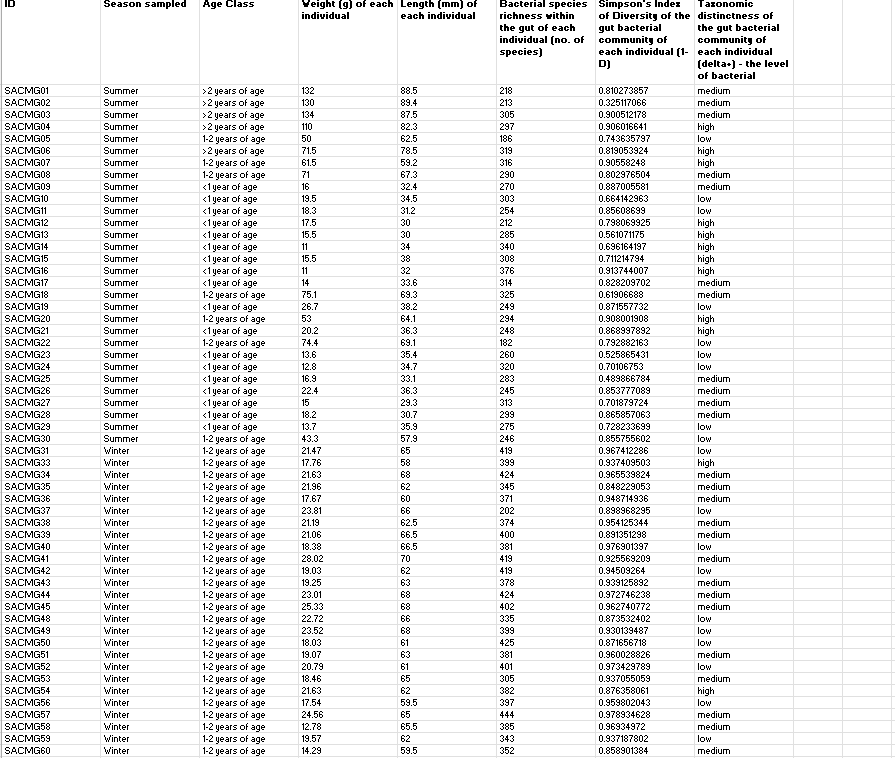
I. Using an appropriate graphical display and the summary statistics, describe the distribution of BOTH length and weight of
II. Using an appropriate graphical format, display AND describe the relationship between length and weight of
III. How much variation in weight can be explained by variation in length in this particular Summer
IV. Interestingly, in the Summer 1-2+ years of age mussel population, 90.2% of the variation in weight can be explained by variation in length alone. How does this compare to the Summer
V. Find the sample correlation coefficient between length and weight for this Summer
VI. Fit a least-squares line to this data (
VII. Predict how heavy (in grams) a mussel may be if it has a length of (a) 31 mm, (b) 37 mm, and (c) 60 mm in this Summer
can you please display a photo of graph and what goes on what axis especially for question II
Step by Step Solution
There are 3 Steps involved in it
Step: 1

Get Instant Access to Expert-Tailored Solutions
See step-by-step solutions with expert insights and AI powered tools for academic success
Step: 2

Step: 3
Ace Your Homework with AI
Get the answers you need in no time with our AI-driven, step-by-step assistance
Get Started
The Lean Audit A Detailed User Guide For The Lean Factory Audit Online
Authors: Isaias Wallaker
1st Edition
B09R3HXJ11, 979-8408651320