

Answered step by step
Verified Expert Solution
Question
1 Approved Answer
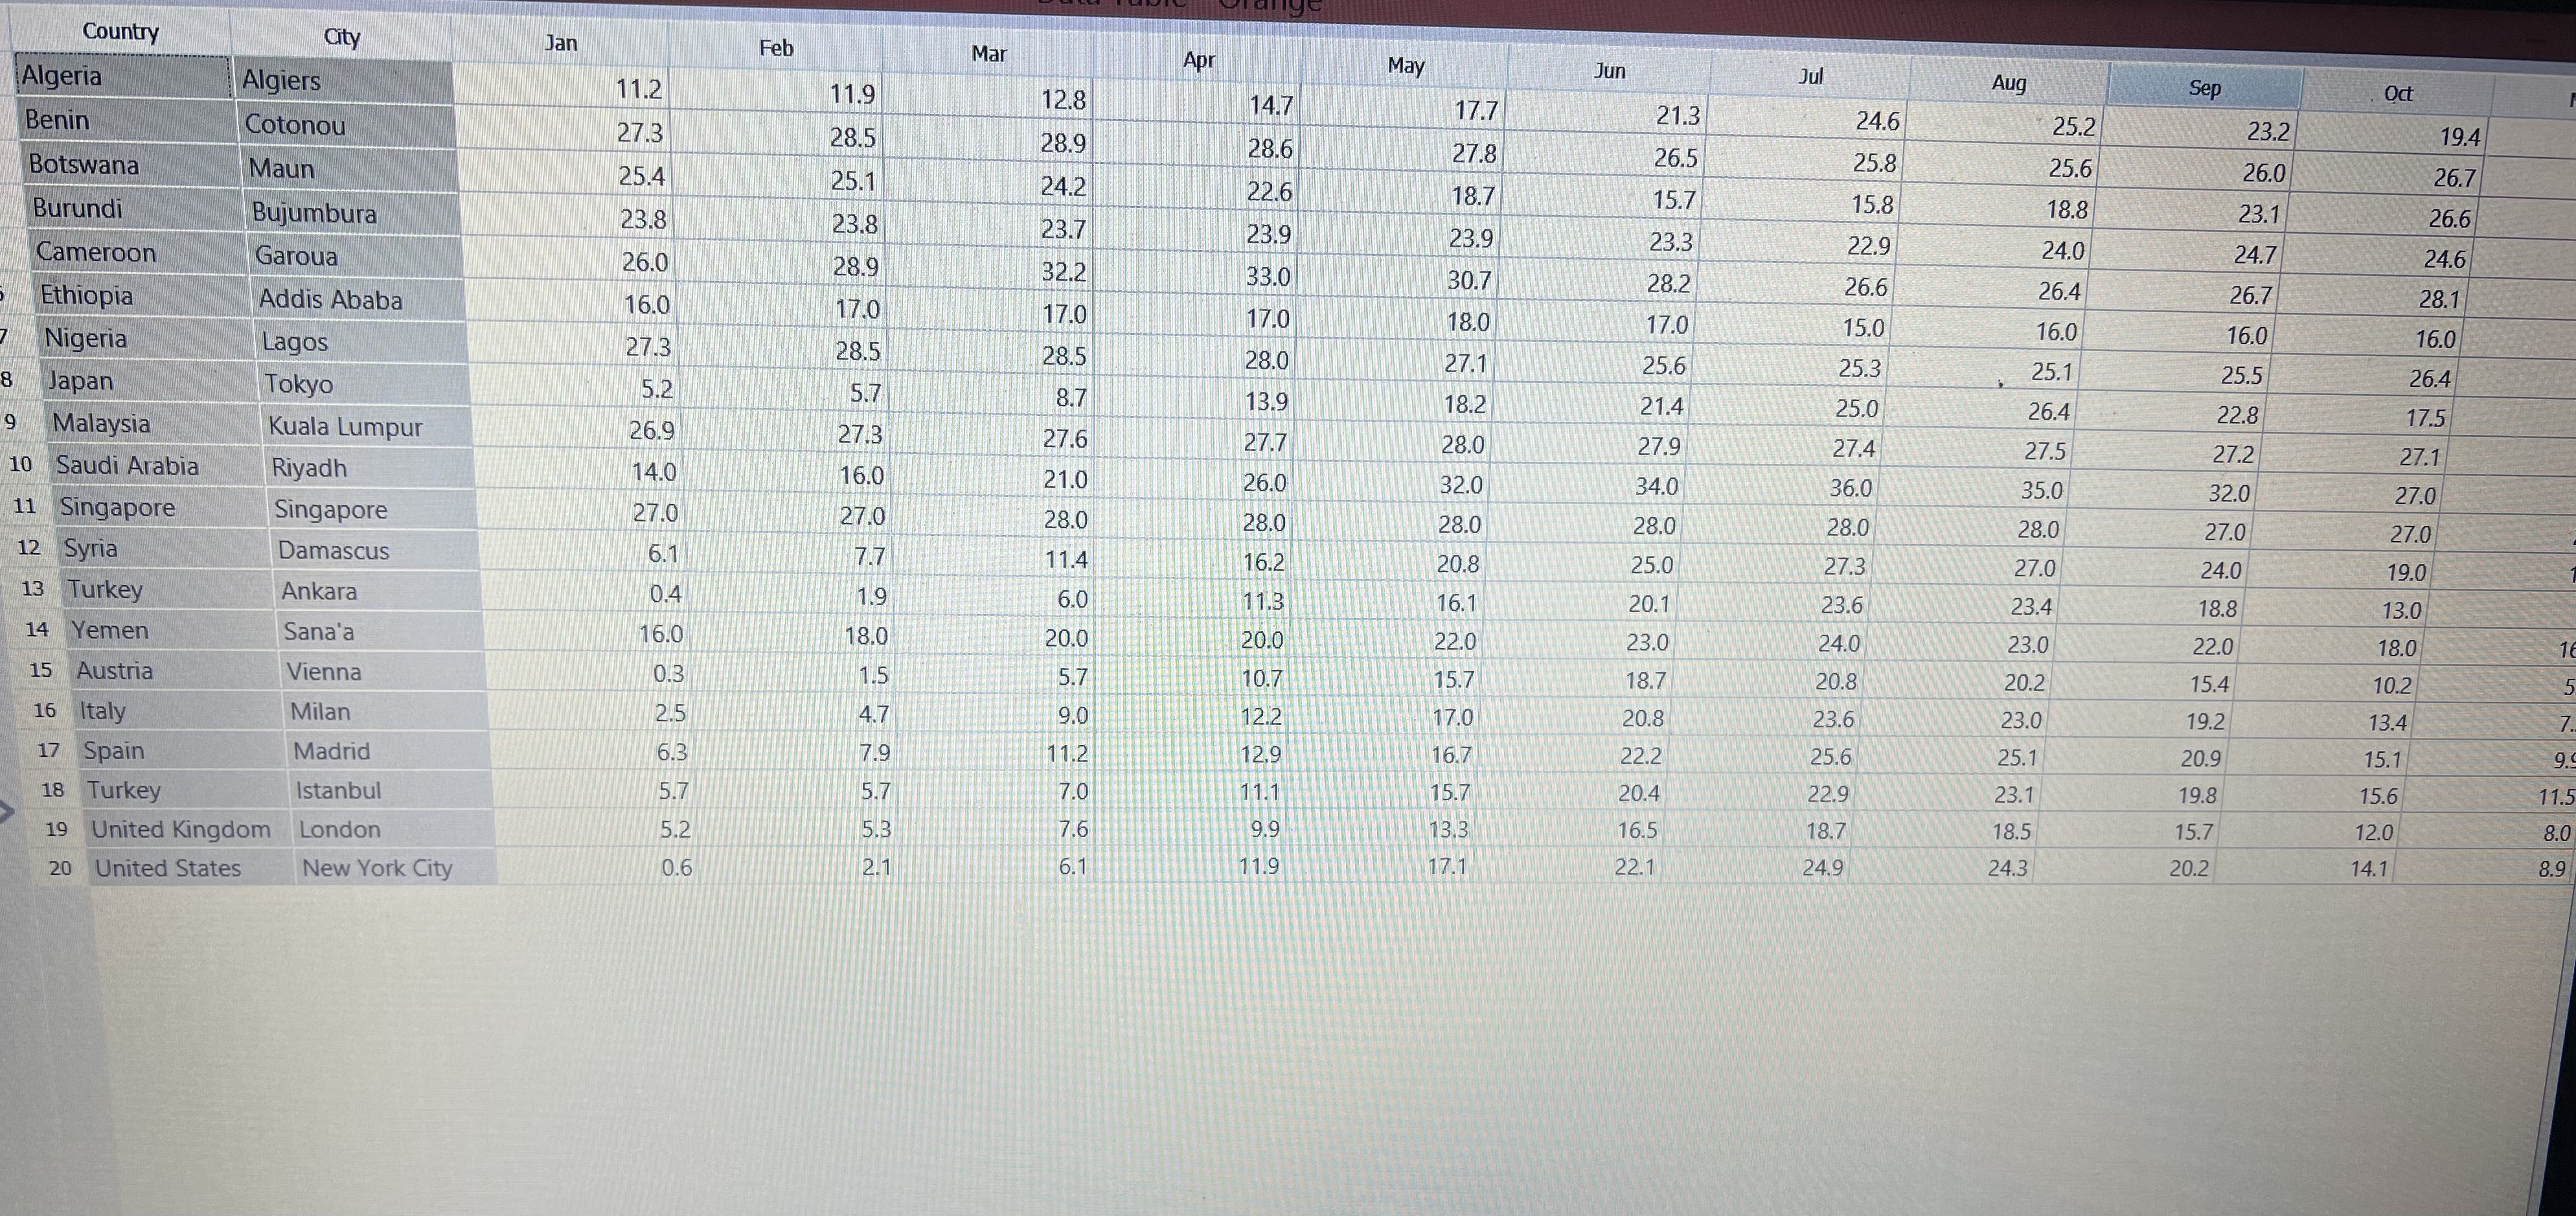
I want a Histogram plotting code in jupyter langauge 1 - contains a read function from csv file as showing 2 - 5 cites to
I want a Histogram plotting code in jupyter langauge
contains a read function from csv file as showing
cites to be displayed with crosspend it month that contain tempreature values
cities are riyadh, tokoyo, vieena,new yotk city
disply the values of all month tempreature for each city
x axis contains months
y axis contain temprature
Step by Step Solution
There are 3 Steps involved in it
Step: 1

Get Instant Access to Expert-Tailored Solutions
See step-by-step solutions with expert insights and AI powered tools for academic success
Step: 2

Step: 3
Ace Your Homework with AI
Get the answers you need in no time with our AI-driven, step-by-step assistance
Get Started
Machine Learning And Knowledge Discovery In Databases Applied Data Science Track European Conference Ecml Pkdd 2021 Bilbao Spain September 13 17 2021 Proceedings Part 5 Lnai 12979
Authors: Yuxiao Dong ,Nicolas Kourtellis ,Barbara Hammer ,Jose A. Lozano
1st Edition
3030865169, 978-3030865160