

Question
I WANT DETAILED EXPLANATION REGARDGING THIS QUESTION EACH STEP OF EXCEL HOW TO DO IT PLEASE URGENT SUV sales data below has data on quarterly
I WANT DETAILED EXPLANATION REGARDGING THIS QUESTION EACH STEP OF EXCEL HOW TO DO IT PLEASE URGENT SUV sales data below has data on quarterly sales of number of four-wheel drive sports utility vehicles(SUV) sold at a dealership for the years 2014 thru 2016. Using Excels Data Analysis add-in, develop forecast sales for year 2017 using Excels forecast sheet for seasonal data. A) The dealership believes that there is a way to predict future demands for
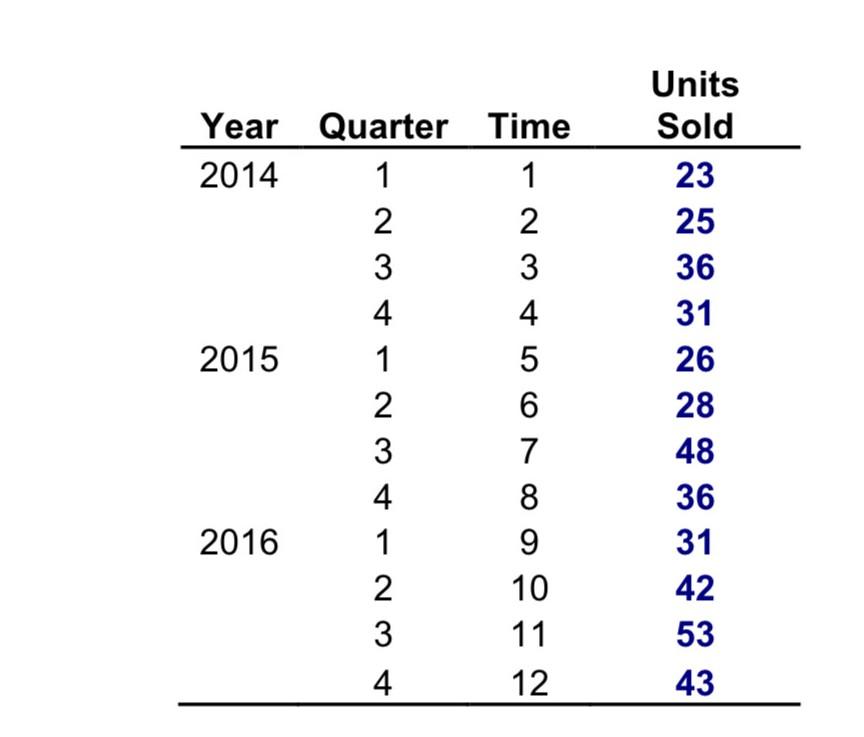
the number od SUV sales using the exponential smoothing model. Develop such a model with an alpha of 0.1 and forecast the sales for 2017. Also develop a Mean absolute Deviation (MAD)metric for this prediction.
\begin{tabular}{cccc} Year & Quarter & Time & \begin{tabular}{c} Units \\ Sold \end{tabular} \\ \hline 2014 & 1 & 1 & 23 \\ & 2 & 2 & 25 \\ & 3 & 3 & 36 \\ & 4 & 4 & 31 \\ 2015 & 1 & 5 & 26 \\ & 2 & 6 & 28 \\ & 3 & 7 & 48 \\ 2016 & 4 & 8 & 36 \\ & 1 & 9 & 31 \\ & 2 & 10 & 42 \\ & 3 & 11 & 53 \\ & 4 & 12 & 43 \\ \hline \end{tabular}Step by Step Solution
There are 3 Steps involved in it
Step: 1

Get Instant Access to Expert-Tailored Solutions
See step-by-step solutions with expert insights and AI powered tools for academic success
Step: 2

Step: 3
Ace Your Homework with AI
Get the answers you need in no time with our AI-driven, step-by-step assistance
Get Started
Database Management An Organizational Perspective
Authors: Richard T. Watson
1st Edition
0471305340, 978-0471305347