

Answered step by step
Verified Expert Solution
Question
1 Approved Answer
i want it on Population growth rate in Saudi Arabia This project should be done individually (no grouping is allowed). Students should search and find
i want it on Population growth rate in Saudi Arabia 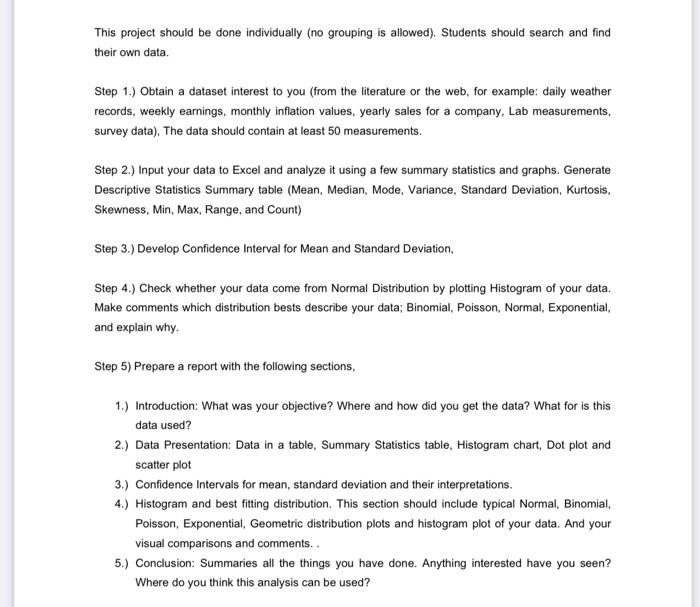
This project should be done individually (no grouping is allowed). Students should search and find their own data. Step 1.) Obtain a dataset interest to you (from the literature or the web, for example: daily weather records, weekly earnings, monthly inflation values, yearly sales for a company, Lab measurements, survey data), The data should contain at least 50 measurements. Step 2.) Input your data to Excel and analyze it using a few summary statistics and graphs. Generate Descriptive Statistics Summary table (Mean, Median, Mode, Variance, Standard Deviation, Kurtosis, Skewness, Min, Max, Range, and Count) Step 3.) Develop Confidence Interval for Mean and Standard Deviation, Step 4.) Check whether your data come from Normal Distribution by plotting Histogram of your data. Make comments which distribution bests describe your data; Binomial, Poisson, Normal, Exponential, and explain why. Step 5) Prepare a report with the following sections, 1.) Introduction: What was your objective? Where and how did you get the data? What for is this data used? 2.) Data Presentation: Data in a table, Summary Statistics table, Histogram chart, Dot plot and scatter plot 3.) Confidence Intervals for mean, standard deviation and their interpretations. 4.) Histogram and best fitting distribution. This section should include typical Normal, Binomial, Poisson, Exponential, Geometric distribution plots and histogram plot of your data. And your visual comparisons and comments. . 5.) Conclusion: Summaries all the things you have done. Anything interested have you seen? Where do you think this analysis can be used? This project should be done individually (no grouping is allowed). Students should search and find their own data. Step 1.) Obtain a dataset interest to you (from the literature or the web, for example: daily weather records, weekly earnings, monthly inflation values, yearly sales for a company, Lab measurements, survey data), The data should contain at least 50 measurements. Step 2.) Input your data to Excel and analyze it using a few summary statistics and graphs. Generate Descriptive Statistics Summary table (Mean, Median, Mode, Variance, Standard Deviation, Kurtosis, Skewness, Min, Max, Range, and Count) Step 3.) Develop Confidence Interval for Mean and Standard Deviation, Step 4.) Check whether your data come from Normal Distribution by plotting Histogram of your data. Make comments which distribution bests describe your data; Binomial, Poisson, Normal, Exponential, and explain why. Step 5) Prepare a report with the following sections, 1.) Introduction: What was your objective? Where and how did you get the data? What for is this data used? 2.) Data Presentation: Data in a table, Summary Statistics table, Histogram chart, Dot plot and scatter plot 3.) Confidence Intervals for mean, standard deviation and their interpretations. 4.) Histogram and best fitting distribution. This section should include typical Normal, Binomial, Poisson, Exponential, Geometric distribution plots and histogram plot of your data. And your visual comparisons and comments. . 5.) Conclusion: Summaries all the things you have done. Anything interested have you seen? Where do you think this analysis can be used Step by Step Solution
There are 3 Steps involved in it
Step: 1

Get Instant Access to Expert-Tailored Solutions
See step-by-step solutions with expert insights and AI powered tools for academic success
Step: 2

Step: 3
Ace Your Homework with AI
Get the answers you need in no time with our AI-driven, step-by-step assistance
Get Started
Fundamental Managerial Accounting Concepts
Authors: Edmonds, Tsay, olds
6th Edition
71220720, 78110890, 9780071220729, 978-0078110894