

Answered step by step
Verified Expert Solution
Question
1 Approved Answer
I want its answer in excel sheet. the present answer is in word document. it will he more helpful if i get in excek formal
I want its answer in excel sheet. the present answer is in word document.
Question 1 20 pts Walmart Corporation is a national retail department store. The company's total revenues for the twelve months ended December 31, 2021, were $19 billion. Freshco is a larger department store company with $26.1 billion of revenues for the same period. Ratio Walmart Freshco Gross Profit Percentage 35.9% 39.1% Net Profit Margin 1.7% 2.6% Return on Equity 5.9% 16.8% EPS $3.27 $2.13 Inventory Turnover Ratio 2.69 2.64 Current Ratio 1.68 1.31 Debt-to-assets 0.64 0.82 P/E ratio 12.6 15.1 Required: 1. Which company appears more profitable? Describe the ratio(s) that you used to reach this decision. 2. Which company appears more liquid? Describe the ratio(s) that you used to reach this decision. 3. Which company appears more solvent? Describe the ratio(s) that you used to reach this decision. 4. Are the conclusions from your analyses in requirements 1-3 consistent with the value of the two companies, as suggested by their P/E ratios? If not, offer one explanation for any apparent inconsistency. HINT: The stock price in the top of the P/E ratio represents investors' expectations about future financial performance whereas the bottom number reports past financial performance Question 1 20 pts Walmart Corporation is a national retail department store. The company's total revenues for the twelve months ended December 31, 2021, were $19 billion. Freshco is a larger department store company with $26.1 billion of revenues for the same period. Ratio Walmart Freshco Gross Profit Percentage 35.9% 39.1% Net Profit Margin 1.7% 2.6% Return on Equity 5.9% 16.8% EPS $3.27 $2.13 Inventory Turnover Ratio 2.69 2.64 Current Ratio 1.68 1.31 Debt-to-assets 0.64 0.82 P/E ratio 12.6 15.1 Required: 1. Which company appears more profitable? Describe the ratio(s) that you used to reach this decision. 2. Which company appears more liquid? Describe the ratio(s) that you used to reach this decision. 3. Which company appears more solvent? Describe the ratio(s) that you used to reach this decision. 4. Are the conclusions from your analyses in requirements 1-3 consistent with the value of the two companies, as suggested by their P/E ratios? If not, offer one explanation for any apparent inconsistency. HINT: The stock price in the top of the P/E ratio represents investors' expectations about future financial performance whereas the bottom number reports past financial performance it will he more helpful if i get in excek formal with good explanation 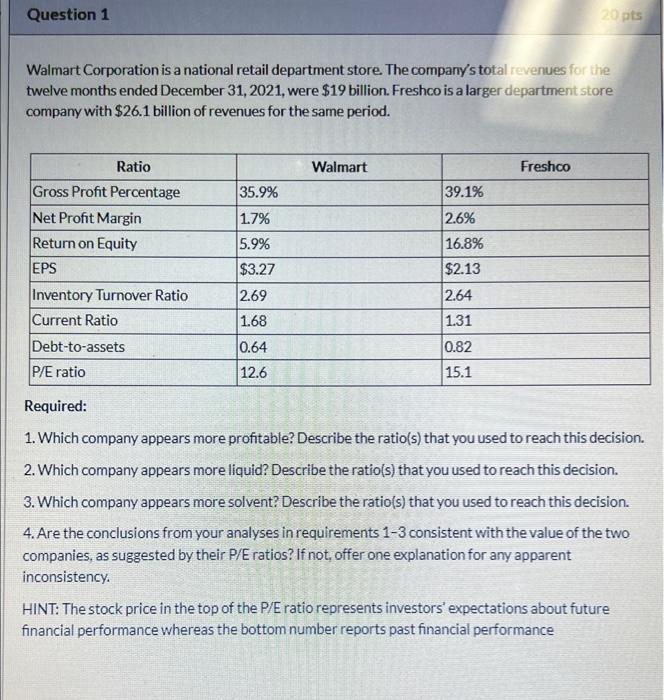
Step by Step Solution
There are 3 Steps involved in it
Step: 1

Get Instant Access to Expert-Tailored Solutions
See step-by-step solutions with expert insights and AI powered tools for academic success
Step: 2

Step: 3
Ace Your Homework with AI
Get the answers you need in no time with our AI-driven, step-by-step assistance
Get Started
Risk Management And Financial Institutions
Authors: John Hull
1st Edition
0132397900, 9780132397902