Answered step by step
Verified Expert Solution
Link Copied!

Question

1 Approved Answer

i want konw the answer The Excel sheet on the below shows a company's profit (in $1000s), average local temperature ( C), average number of

i want konw the answer
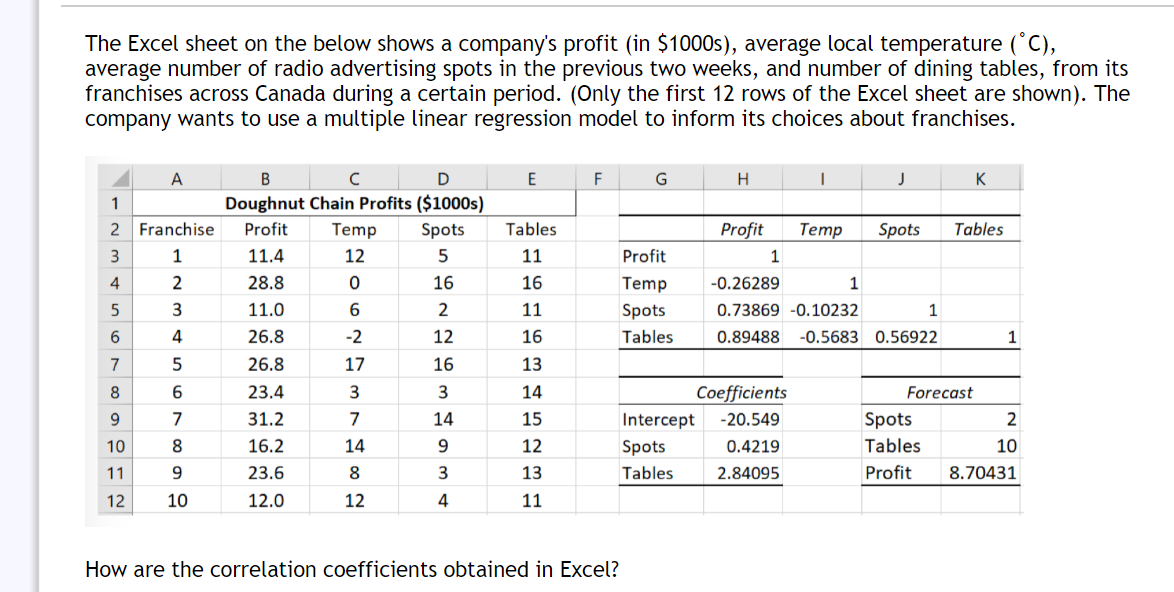
image text in transcribedimage text in transcribed
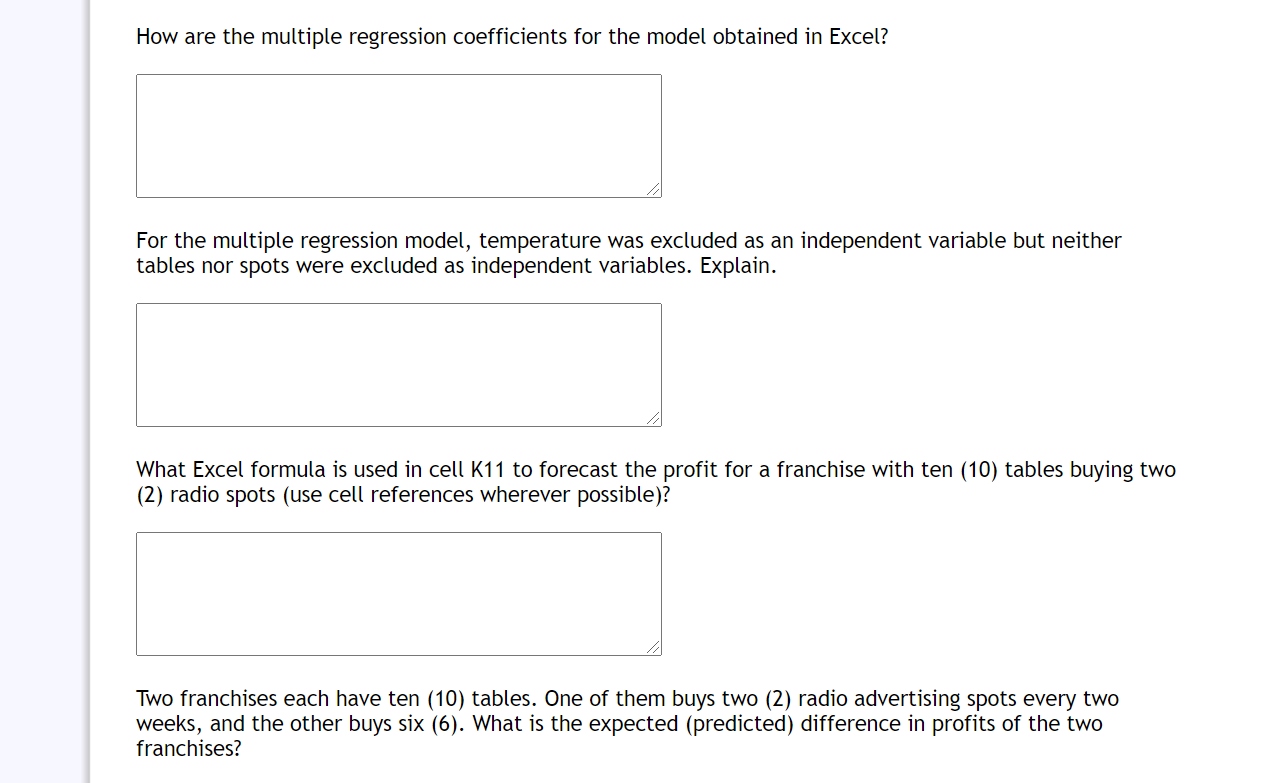
The Excel sheet on the below shows a company's profit (in $1000s), average local temperature ( C), average number of radio advertising spots in the previous two weeks, and number of dining tables, from its franchises across Canada during a certain period. (Only the first 12 rows of the Excel sheet are shown). The company wants to use a multiple linear regression model to inform its choices about franchises. A B C D E F G H K Doughnut Chain Profits ($1000s) 2 Franchise Profit Temp Spots Tables Profit Temp Spots Tables 3 11.4 12 5 11 Profit 1 A 28.8 0 16 16 Temp -0.26289 1 11.0 6 2 11 Spots 0.73869 -0.10232 1 26.8 -2 12 16 Tables 0.89488 -0.5683 0.56922 26.8 17 16 13 8 6 23.4 3 3 14 Coefficients Forecast 7 31.2 7 14 15 Intercept -20.549 Spots 2 10 8 16.2 14 9 12 Spots 0.4219 Tables 10 11 9 23.6 8 3 13 Tables 2.84095 Profit 8.70431 12 10 12.0 12 4 11 How are the correlation coefficients obtained in Excel?How are the multiple regression coefficients for the model obtained in Excel? A For the multiple regression model, temperature was excluded as an independent variable but neither tables nor spots were excluded as independent variables. Explain. A What Excel formula is used in cell K11 to forecast the profit for a franchise with ten (10) tables buying two (2) radio spots (use cell references wherever possible)? A Two franchises each have ten (10) tables. One of them buys two (2) radio advertising spots every two weeks, and the other buys six {6). What is the expected (predicted) difference in profits of the two franchises

Step by Step Solution

There are 3 Steps involved in it

Step: 1

blur-text-image

Get Instant Access to Expert-Tailored Solutions

See step-by-step solutions with expert insights and AI powered tools for academic success

Step: 2

blur-text-image_2

Step: 3

blur-text-image_3

Ace Your Homework with AI

Get the answers you need in no time with our AI-driven, step-by-step assistance

Get Started

Recommended Textbook for

An Introduction to the Mathematics of financial Derivatives

Authors: Salih N. Neftci

2nd Edition

978-0125153928, 9780080478647, 125153929, 978-0123846822

More Books

Students also viewed these Mathematics questions