Answered step by step
Verified Expert Solution
Question
1 Approved Answer
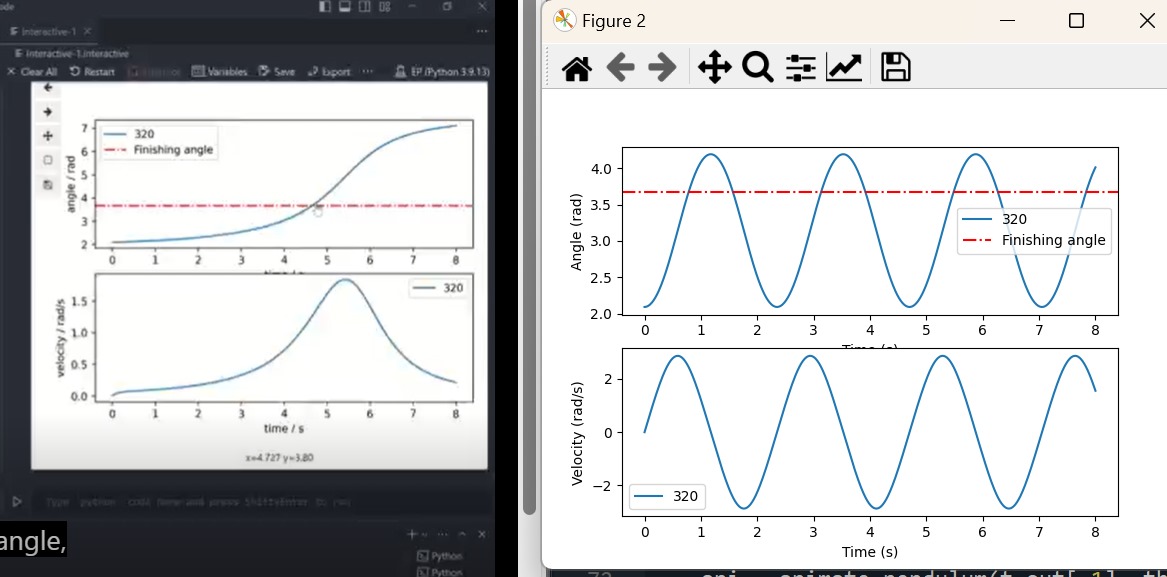
I want the graph to look like the left one and I want the pendulum to turn from thet _ in to thet _ out.
I want the graph to look like the left one and I want the pendulum to turn from thetin to thetout. The pendulum is run by the motor so that it could turn, but im not sure why it is not working as expected the graph produimport numpy as np
import matplotlib.pyplot as plt
from scipy.integrate import solveivp
from PendulumAnimations import animatependulum
#Known parameters
g #ms
L #m
m #kg
thetin nppi #starting angle of mechanism rad
thetout nppi #Finishing angle rad
#Motor constants
Ts #Stall Torque, FROM CATALOGUE Nm
omegam nppi #No load angular speed rads
k Ts omegam #motor gradient constant
#Range of gear ratios to try
#Gr
Gr
#Equation of motion of a pendulum
def fnewtz vr:
def ft z:
theta z
omega z
if theta thetout:
Tm vr k thetout theta #motor torque
elif theta thetin:
Tm vr k thetin theta
else:
Tm
alpha Tm mgLnpsinthetamL # so will rotate upwards
dz omega alpha
return dz
return ft z
#Creating events function to terminate exactly where we specificy
def myeventtz vr:#t time, z state displacement
return z nppi #returns the first state displacement
myevent.terminal True #solveivp will stop when this condition is met
myevent.direction #controls the way in which the evnt is triggered
#the event will only trigger when the event function output reaches zero in a positive direction
#Solver parameters
T #Time for it to run for s
IC thetin # Initial conditions position in angle, velocity
tout #time array
zout #data array position velocity
#Solvers
for i in rangelenGr:
vr Gri #iterate ranges of gear ratios
sol solveivpfnew, T IC rtol e maxstep e args vr events myevent
t sol.t
z sol.y
tout.appendt
zout.appendz
#animate
animate True #will only animate when its true
#thetgr
if animate True:
thet zout
ani animatependulumtout thet:
#Plots
fig, ax pltsubplots
for i in rangelentout:
axplottouti zouti: label strGri
axaxhliney thetout, linestyle label 'Finishing angle', color 'red'
axsetxlabelTime s
axsetylabelAngle rad
axlegend
#Velocity
for i in rangelentout:
axplottouti zouti: label strGri
axsetxlabelTime s
axsetylabelVelocity rads
axlegendced is not the same Here is my code:

Step by Step Solution
There are 3 Steps involved in it
Step: 1

Get Instant Access to Expert-Tailored Solutions
See step-by-step solutions with expert insights and AI powered tools for academic success
Step: 2

Step: 3

Ace Your Homework with AI
Get the answers you need in no time with our AI-driven, step-by-step assistance
Get Started


