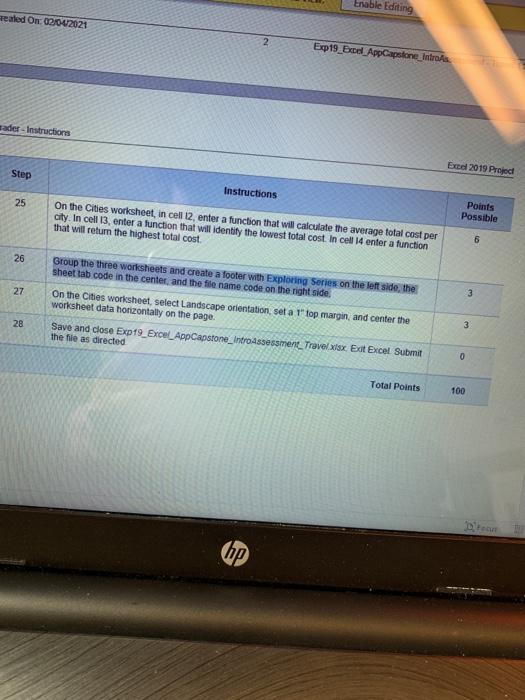
I want the pichtures for step 26.. please explain with pictures
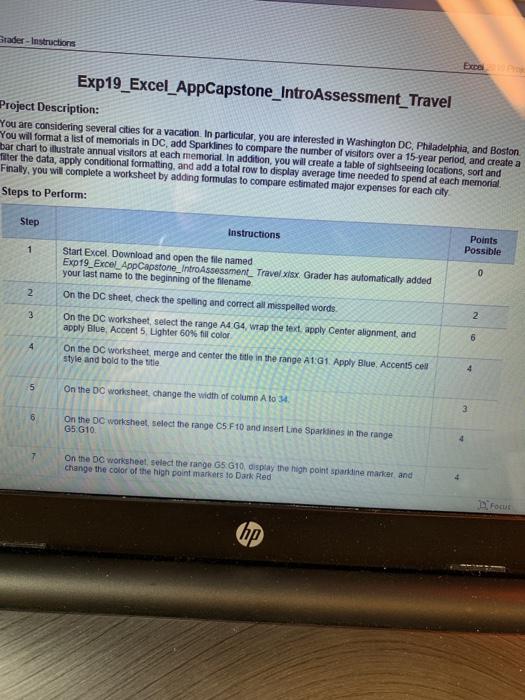
Stader - Instructions Exp19_Excel_AppCapstone_Intro Assessment_Travel Project Description: You are considering several cities for a vacation. In particular, you are interested in Washington DC, Philadelphia, and Boston You wil format a list of memorials in DC, add Sparklines to compare the number of visitors over a 15 year period, and create a bar chart to illustrate annual visitors at each memorial. In addition, you will create a table of sightseeing locations, sort and filter the data, apply conditional formatting, and add a total row to display average time needed to spend at each memorial Finally, you will complete a worksheet by adding formulas to compare estimated major expenses for each city Steps to Perform: Step Instructions Points Possible 1 0 2 Start Excel. Download and open the file named Exp19_Excel App Capstone_Intro Assessment Travelmix Grader has automatically added your last name to the beginning of the filename On the DC sheet, check the speling and correct all misspelled words On the DC worksheet, select the range A4 G4 wrap the text apply Center alignment, and apply Blue, Accent 5. Lighter 60% il color On the DC worksheet merge and center the title in the range A1.G1. Apply Blue, Accents cel style and bold to the title 3 2 6 4 4 5 On the DC worksheet change the width of column A to 34 3 6 On the DC worksheet, select the range CS F10 and insert Line Sparklines in the range G5 G10 On the DC worksheet, select the range 65 610, display the high point sparkline market and change the color of the high point markers to Dark Red Focut hp Enable Editing Realed On: 02042021 2 Exp19_Excel AppCapstone_Intro ader - Instructions Excel 2019 Projed Step Instructions 25 On the Cities worksheet, in cell 12, enter a function that will calculate the average total cost per city. In cell 13, enter a function that will identify the lowest total cost. In cell 14 enter a function that will return the highest total cost Points Possible 6 26 Group the three worksheets and create a footer with Exploring Series on the left side, the sheet tab code in the center, and the file name code on the right side On the Cities worksheet, select Landscape orientation set a l' top margin, and center the worksheet data horizontally on the page. 27 3 28 3 Save and close Exp19_Excel_App Capstone_Introssessment_Travel tsx Edt Excel Submit the file as directed 0 Total Points 100 bp

 I want the pichtures for step 26.. please explain with pictures


