Answered step by step
Verified Expert Solution
Question
1 Approved Answer
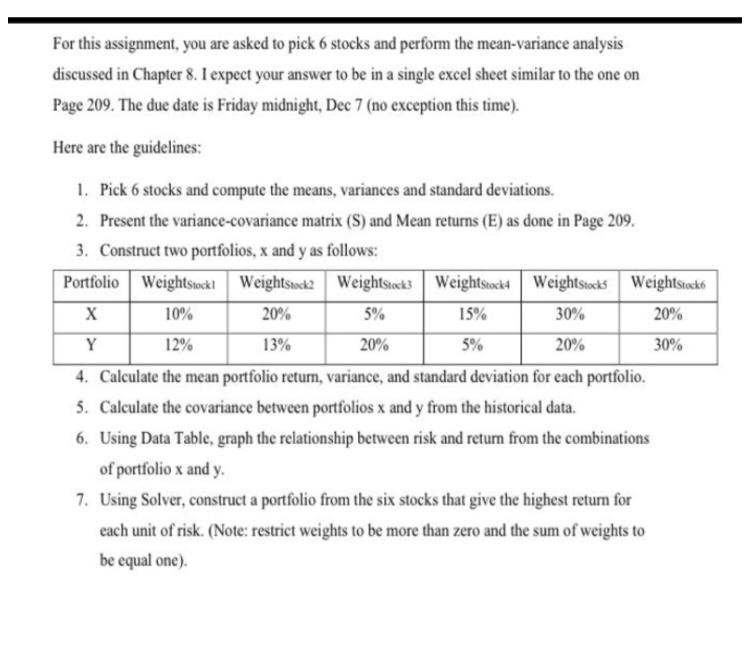
i want the solution via excel file For this assignment, you are asked to pick 6 stocks and perform the mean-variance analysis discussed in Chapter

i want the solution via excel file
For this assignment, you are asked to pick 6 stocks and perform the mean-variance analysis discussed in Chapter 8. I expect your answer to be in a single excel sheet similar to the one on Page 209. The due date is Friday midnight, Dec 7 (no exception this time). Here are the guidelines: I. Pick 6 stocks and Present the variance-covariance matrix (S) and Mean returns (E) as done in Page 209 Construct two portfolios, x and y as follows: compute the means, variances and standard deviations. 2. 3. Portfolio Weightsok Weightsiok Weightk Weightstock4Weitsoks Weightstok 10% 20% 5% 15% 30% 20% 12% 13% 20% 5% 20% 30% 4. 5. 6. Calculate the mean portfolio return, variance, and standard deviation for each portfolio. Calculate the covariance between portfolios x and y from the historical data. Using Data Table, graph the relationship between risk and return from the combinations of portfolio x and y Using Solver, construct a portfolio from the six stocks that give the highest return for each unit of risk. (Note: restrict weights to be more than zero and the sum of weights to be equal one). 7. For this assignment, you are asked to pick 6 stocks and perform the mean-variance analysis discussed in Chapter 8. I expect your answer to be in a single excel sheet similar to the one on Page 209. The due date is Friday midnight, Dec 7 (no exception this time). Here are the guidelines: I. Pick 6 stocks and Present the variance-covariance matrix (S) and Mean returns (E) as done in Page 209 Construct two portfolios, x and y as follows: compute the means, variances and standard deviations. 2. 3. Portfolio Weightsok Weightsiok Weightk Weightstock4Weitsoks Weightstok 10% 20% 5% 15% 30% 20% 12% 13% 20% 5% 20% 30% 4. 5. 6. Calculate the mean portfolio return, variance, and standard deviation for each portfolio. Calculate the covariance between portfolios x and y from the historical data. Using Data Table, graph the relationship between risk and return from the combinations of portfolio x and y Using Solver, construct a portfolio from the six stocks that give the highest return for each unit of risk. (Note: restrict weights to be more than zero and the sum of weights to be equal one). 7Step by Step Solution
There are 3 Steps involved in it
Step: 1

Get Instant Access to Expert-Tailored Solutions
See step-by-step solutions with expert insights and AI powered tools for academic success
Step: 2

Step: 3

Ace Your Homework with AI
Get the answers you need in no time with our AI-driven, step-by-step assistance
Get Started


