I want to design a project about the electronic menu . For the design thinking of the electronic menu , try to complete the following
I want to design a project about the electronic menu. For the design thinking of the electronic menu, try to complete the following blanks about Peers observing peers and Trend analysis in the two pictures below.
1. Peers observing peers
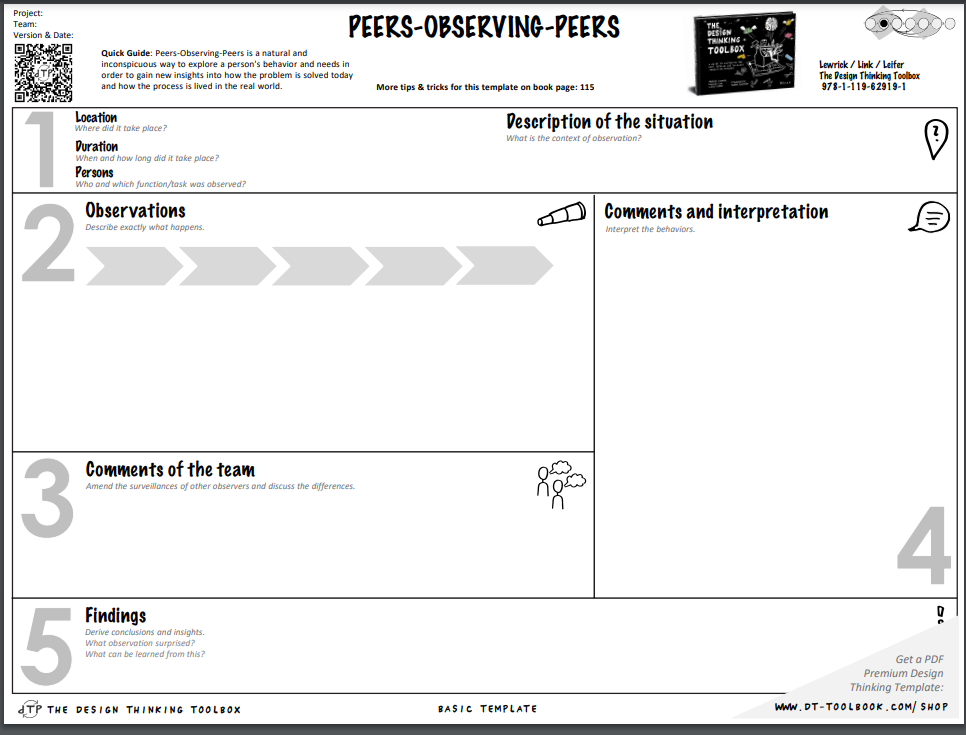
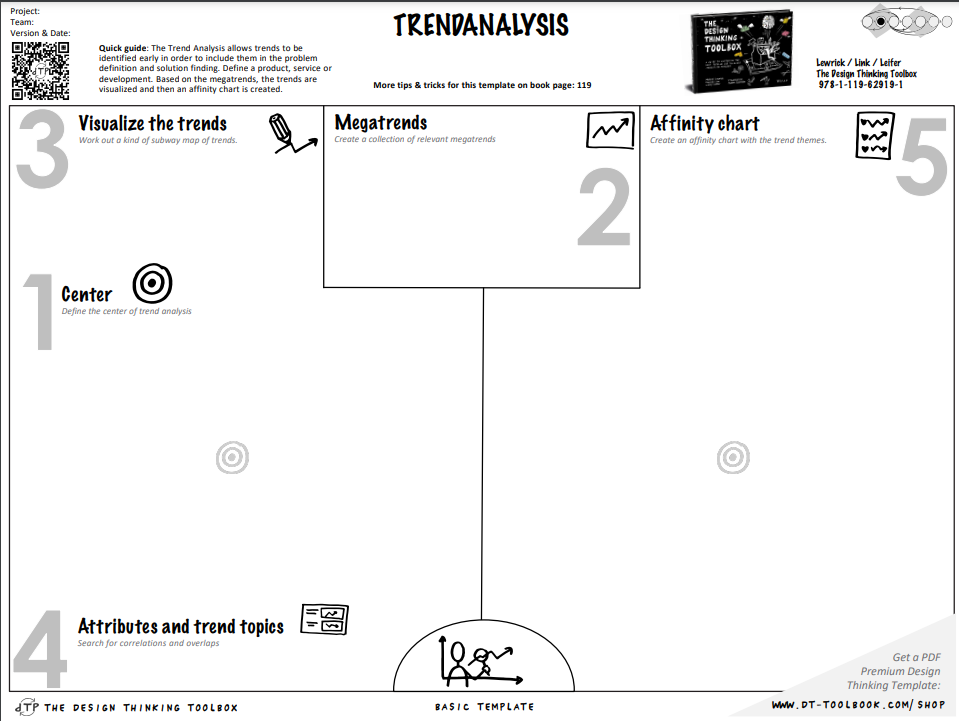
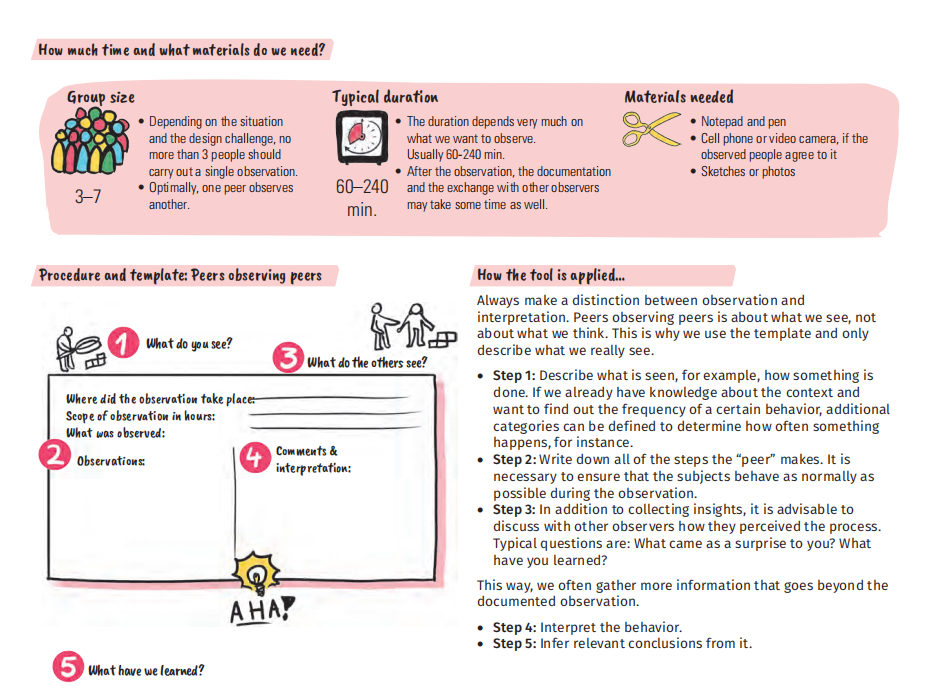
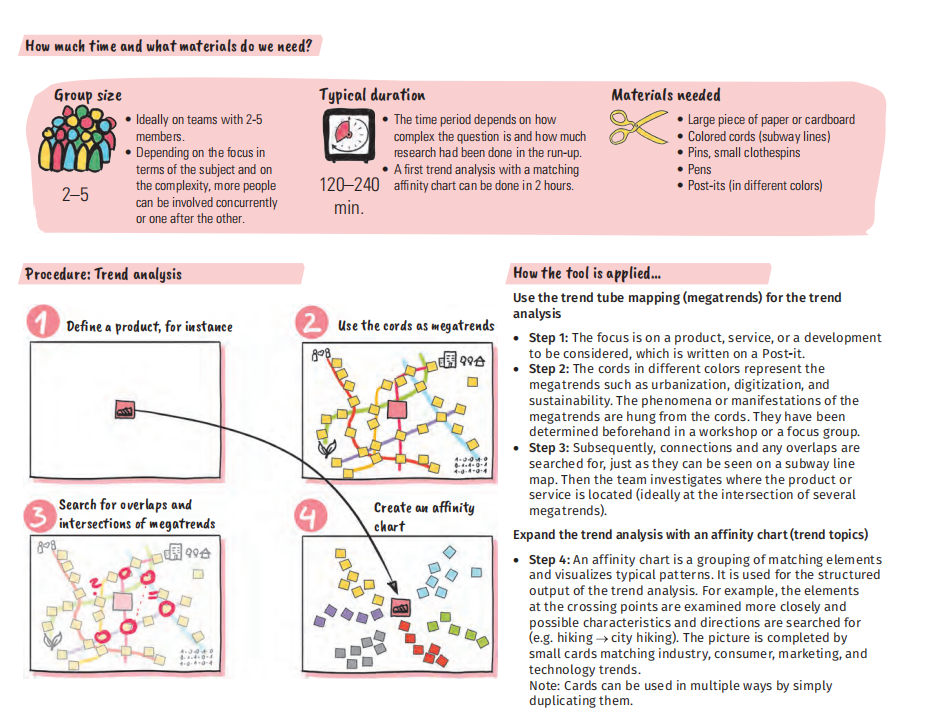
Project: Team PEERS-OBSERVING-PEERS THE Version & Date: DESIGN THINKING . Quick Guide: Peers-Observing-Peers is a natural and TOOLBOX JERK inconspicuous way to explore a person's behavior and needs in Lewrick / Link / Leifer order to gain new insights into how the problem is solved today The Design Thinking Toolbox and how the process is lived in the real world. More tips & tricks for this template on book page: 115 978-1-119-62919-1 Location Where did it take place? Description of the situation Duration What is the context of observation? When and how long did it take place? Persons Who and which function/task was observed? 2 Observations Comments and interpretation Describe exactly what happens. Interpret the behaviors. 3 Comments of the team Amend the surveillances of other observers and discuss the differences. 4 Findings 5 Derive conclusions and insights. What observation surprised? What can be learned from this? Get a PDF Premium Design Thinking Template: ATP THE DESIGN THINKING TOOLBOX BASIC TEMPLATE WWW. DT-TOOLBOOK. COM/ SHOPProject: Team: Version & Date: TRENDANALYSIS THE THINKING Quick guide: The Trend Analysis allows trends to be TOOLBOX identified early in order to include them in the problem definition and solution finding. Define a product, service or Lewrick / Link / Leifer development. Based on the megatrends, the trends are The Design Thinking Toolbox visualized and then an affinity chart is created. More tips & tricks for this template on book page: 119 978-1-119-62919-1 3 Visualize the trends Megatrends M Affinity chart Work out a kind of subway map of trends. Create a collection of relevant megatrends Create an affinity chart with the trend themes. 5 N Center O Define the center of trend analysis O O Attributes and trend topics Search for correlations and overlaps Get a PDF Premium Design Thinking Template: TP THE DESIGN THINKING TOOLBOX BASIC TEMPLATE WWW. DT-TOOLBOOK. COM/ SHOPHow much time and what materials do we need? Group size Typical duration Materials needed . Depending on the situation . The duration depends very much on . Notepad and pen and the design challenge, no what we want to observe. . Cell phone or video camera, if the more than 3 people should Usually 60-240 min. observed people agree to it carry out a single observation. . After the observation, the documentation . Sketches or photos 3-7 . Optimally, one peer observes 60-240 and the exchange with other observers another. min. may take some time as well. Procedure and template: Peers observing peers How the tool is applied. Always make a distinction between observation and interpretation. Peers observing peers is about what we see, not What do you see? about what we think. This is why we use the template and only 3 describe what we really see. What do the others see? . Step 1: Describe what is seen, for example, how something is Where did the observation take place: done. If we already have knowledge about the context and Scope of observation in hours: want to find out the frequency of a certain behavior, additional What was observed: categories can be defined to determine how often something 2 4 Comments & happens, for instance. Observations: interpretation: Step 2: Write down all of the steps the "peer" makes. It is necessary to ensure that the subjects behave as normally as possible during the observation. Step 3: In addition to collecting insights, it is advisable to discuss with other observers how they perceived the process. Typical questions are: What came as a surprise to you? What have you learned? This way, we often gather more information that goes beyond the AHA! documented observation. . Step 4: Interpret the behavior. . Step 5: Infer relevant conclusions from it. 5 What have we learned?How much time and what materials do we need? Group size Typical duration Materials needed . Ideally on teams with 2-5 . The time period depends on how . Large piece of paper or cardboard members. complex the question is and how much . Colored cords (subway lines) . Depending on the focus in research had been done in the run-up. . Pins, small clothespins terms of the subject and on . A first trend analysis with a matching . Pens 2-5 the complexity, more people 120-240 affinity chart can be done in 2 hours. . Post-its (in different colors) can be involved concurrently or one after the other. min. Procedure: Trend analysis How the tool is applied. Use the trend tube mapping (megatrends) for the trend 1 2 analysis Define a product, for instance Use the cords as megatrends Step 1: The focus is on a product, service, or a development to be considered, which is written on a Post-it. Step 2: The cords in different colors represent the megatrends such as urbanization, digitization, and sustainability. The phenomena or manifestations of the megatrends are hung from the cords. They have been determined beforehand in a workshop or a focus group. . Step 3: Subsequently, connections and any overlaps are searched for, just as they can be seen on a subway line map. Then the team investigates where the product or Search for overlaps and service is located (ideally at the intersection of several 4 Create an affinity megatrends). intersections of megatrends chart Expand the trend analysis with an affinity chart (trend topics) Step 4: An affinity chart is a grouping of matching elements and visualizes typical patterns. It is used for the structured output of the trend analysis. For example, the elements LJ at the crossing points are examined more closely and possible characteristics and directions are searched for (e.g. hiking -> city hiking). The picture is completed by small cards matching industry, consumer, marketing, and technology trends. Note: Cards can be used in multiple ways by simply duplicating them
Step by Step Solution
There are 3 Steps involved in it
Step: 1
Get Instant Access to Expert-Tailored Solutions
See step-by-step solutions with expert insights and AI powered tools for academic success
Step: 2
Step: 3
Ace Your Homework with AI
Get the answers you need in no time with our AI-driven, step-by-step assistance